Hello fellow StockCharts users. We seem to be finally gaining some steam here in the markets, but where do we go from here? I thought I would give you a few interesting charts that I'm watching on the S&P 500. I would also like to stress that these charts should be taken as potential areas of resistance and support, not exact targets. No one can possibly know how high we can go - or how low we can go. What we can do, however, is use these charts alongside our risk management tools to help us.
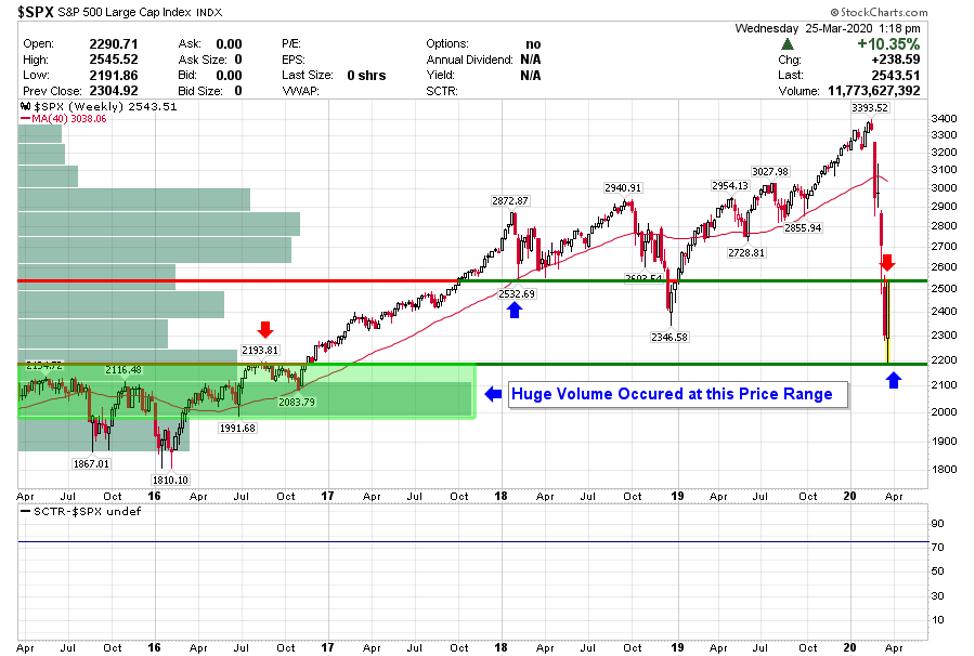
The first chart is the weekly chart of the $SPX. We can see that we hammered off exactly the area we broke out of back in 2016. This is interesting because most breakouts tend to retest at some point. The first area of resistance to watch is around 2532.
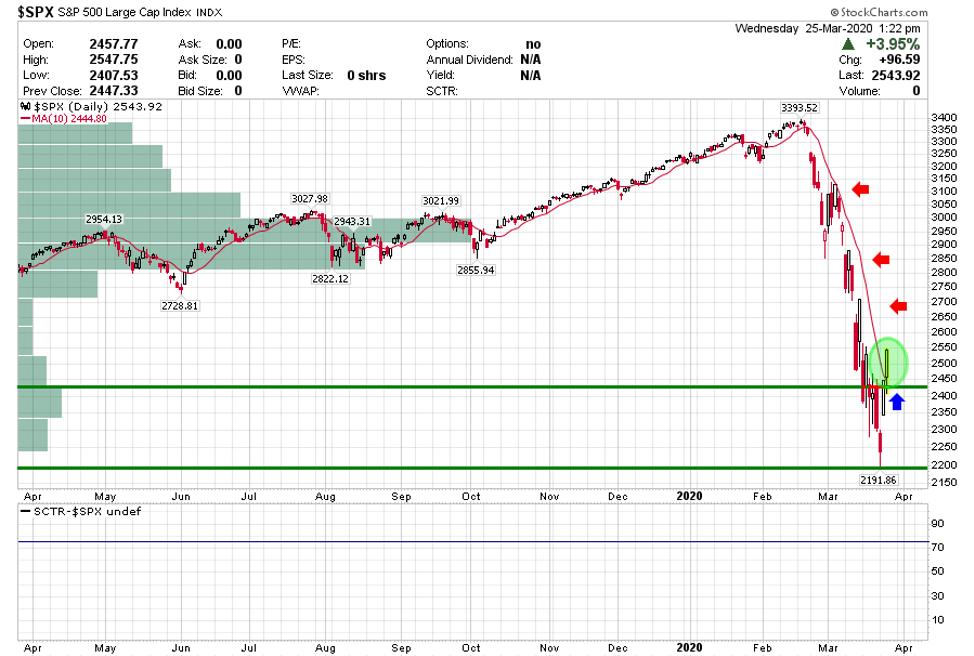
Now let's zoom in further to the daily chart of the $SPX, where I have changed the 40-week moving average to the 10-week moving average. As we can see, the 10-day moving average has acted as resistance on the way down and now we finally seem to be breaking out above it.
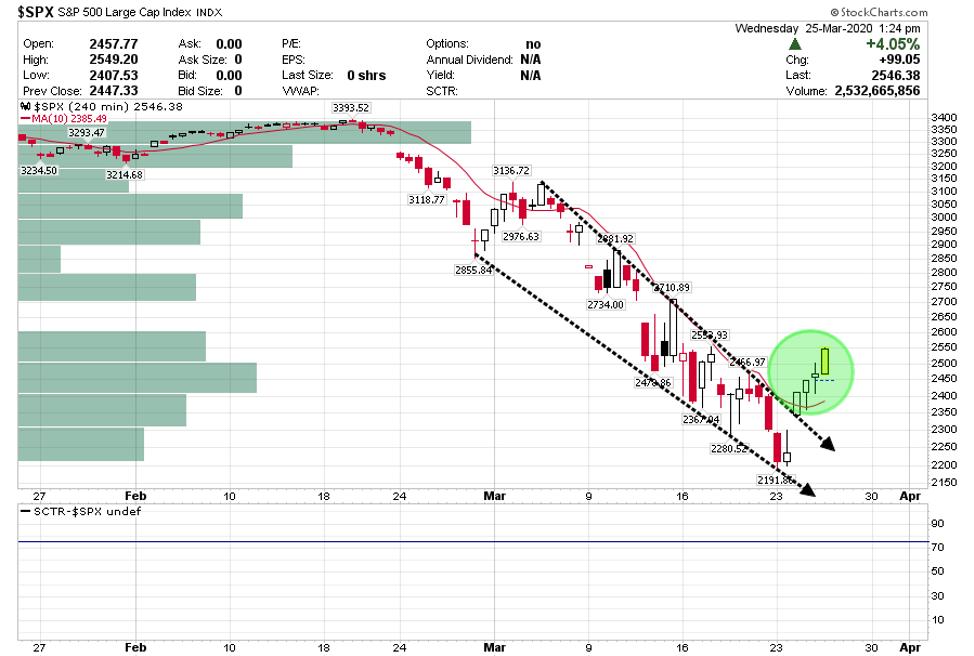
Finally let's take a look at a 2-month chart of the $SPX, where we can observe a breakout of this falling wedge pattern. We can see the breakout above the top trendline of the wedge and a continuation of the move higher.
These are the time frames that seem interesting to me on the $SPX. If you have any interesting charts that you're watching, please don't hesitate to share with via email at bozicmarketreport@gmail.com.
- Aleksandar Bozic