On March 24th, 2020, I wrote an article posted on StockCharts.com titled "Indexes Showing Signs Of Momentum Shifts Pointing Towards Rally". Please feel free to look up that article.
Note: None of the markets, ETFs or stocks listed in this article are recommendations to buy or sell, this article is intended for educational purposes only.
The article outlined patterns and technical analysis that pointed towards a shift in momentum and the likelihood of a measurable rally. A strong rally has now reached measurable retracement levels and, also, potential strong resistance levels in price.
At present, there is a retracement pattern on the Daily SP 500 Emini chart called the "Gartley 222" pattern. The pattern was seen in the 1935 book Profits in the Stock Market, written by H.M. Gartley.
However, Gartley never referred to this pattern himself as a "Gartley" - he had an illustration on page 222 of this book (see Chart 1 below) showing this retracement pattern. Many traders using this pattern today are unaware of the origin of it and, upon reading a copy of this book, are perplexed when trying to find an actual named reference by H.M. Gartley on page 222 of the "Gartley 222" pattern.
Those who dug a little deeper, as Larry Pesavento did in the 1970s and 1980s, discovered that the descriptions starting on page 221, subtitled "One of the Best Trading Opportunities", was able to decipher the illustration of the pattern. Larry Pesavento was the first to title this pattern "Gartley 222," and it's most commonly referred to now as a "Gartley" pattern. This pattern is described in detail in the book Trade What You See, How to Profit From Pattern Recognition (Larry Pesavento and Leslie Jouflas, Wiley 2007).
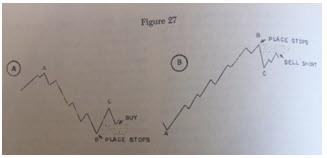
Chart 1 - illustration from 1935 'Profits in the Stock Market', H.M. Gartley
A Gartley pattern is a retracement pattern that has an equal-length AB=CD pattern within a previous swing. These patterns are fractal and will form on all time frames and all markets. Of course, like any technical analysis pattern, there can be failures, meaning price exceeds beyond the completion point D in a manner that invalidates the pattern.
As we will see in Chart 2 below, although there are 2 equal-length swings, AB and CD, there are also extensions of the CD leg that can be very important to study, as the completion can move to one of these areas. Let's start with where the equal length CD leg completes, which we will call the 1.0 D completion. This is in the price area of 2887.
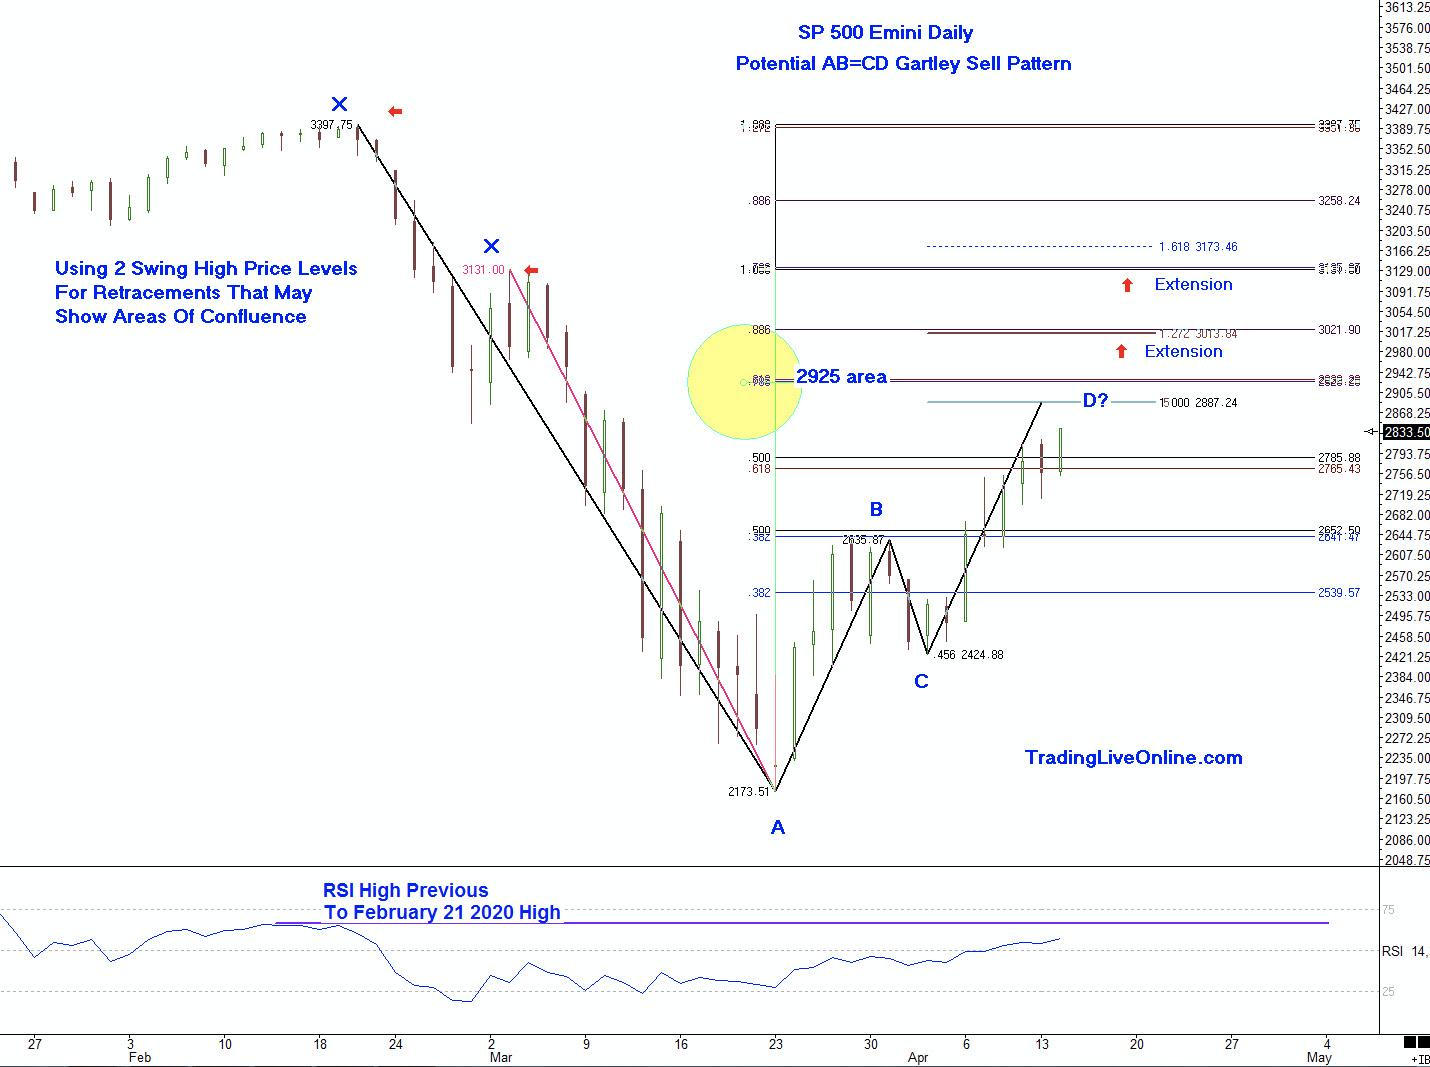
Chart 2 - Daily Chart of the S&P 500 Emini Potential Gartley AB=CD Sell Pattern
That price level, at the 1.0 D completion, is coming back into the first pause and corrective move from the start of the decline in February 2020. These price levels may see resistance.
The area marked on the chart just above in a yellow circle has a confluence of Fibonacci retracements in the 2925 price level. There is a .618 retracement using the February highs, as well as a .786 retracement using the March 2020 highs.
Above that area, you will see 2 red arrows that are marking the 1.27 and 1.618 extensions of this pattern. The extensions are of the CD leg, and you can find them by taking the length of AB, multiplying it by 1.27 or 1.618 (in this case) and adding to the low of C. That will project the extensions. Do the same for a 2.0-or-higher extension and subtract if finding the extensions on a buy pattern.
There are market conditions that sometimes can determine if a D completion may be likely to go to an extension. These include:
- Long strong bars through the 1.0 D completion
- Gap up open in the area of the 1.0 D completion, or an important gap in the early formation of the CD leg, such as a gap out of a consolidation pattern.
Sometimes, momentum indicators can also be useful at completion areas and index comparison.
There are many variations of price behavior around the completion areas; it requires study and training to successfully manage trades using these patterns, such as entry techniques, stop loss placements, exit strategies, market conditions, etc. For comparison, let's look the current Daily NASDAQ potential AB=CD Gartley Sell Pattern in Chart 3.
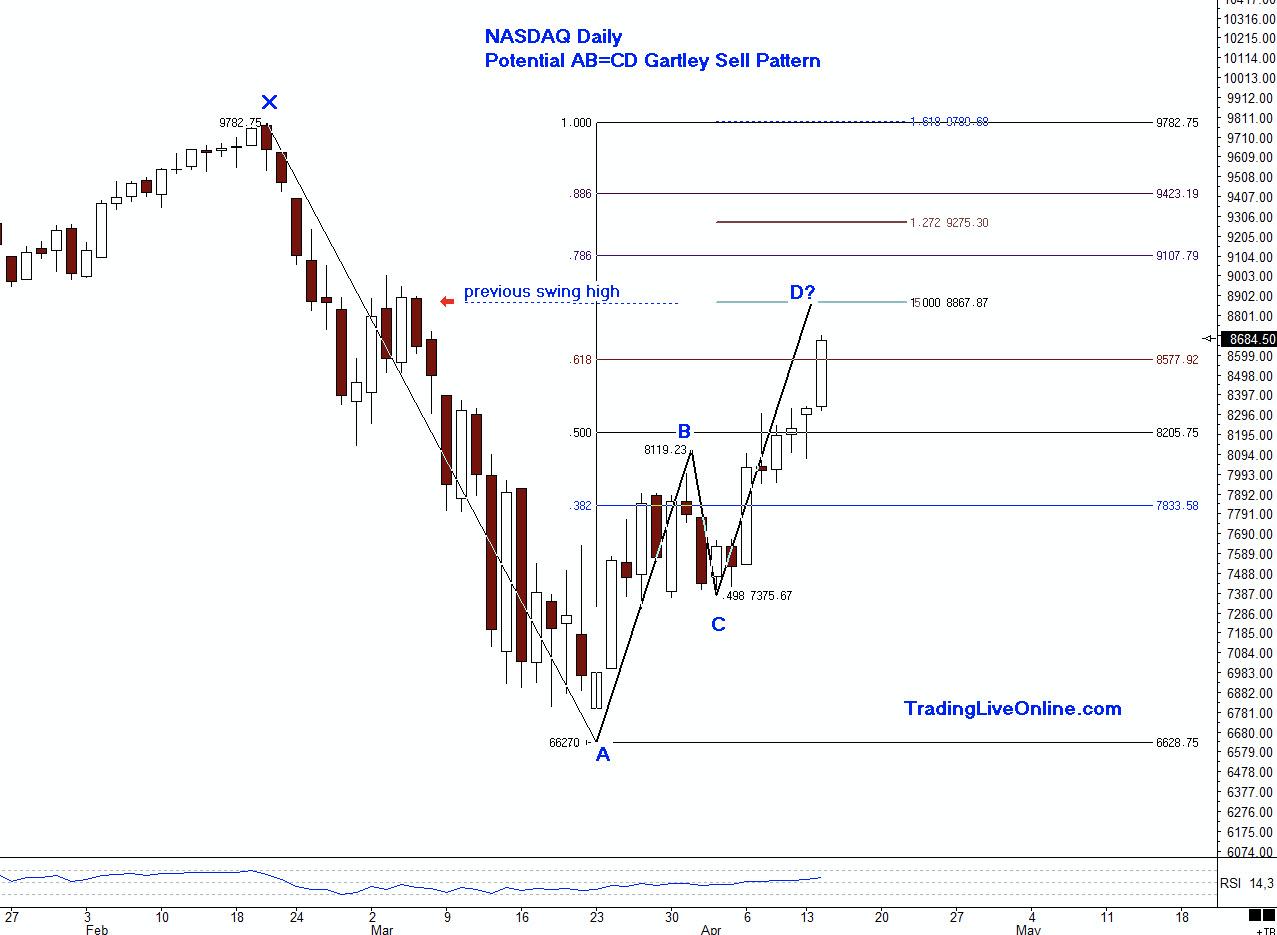
Chart 3 - NASDAQ Daily Potential AB=CD Gartley Sell Pattern
The first thing I noticed when looking at this pattern is the NASDAQ is stronger than the S&P 500 Emini on this retracement up. It has exceeded the .618 retracement using the February 2020 highs. The 1.0 D completion for the NASDAQ is coming in at a retest of the March 2020 highs, obviously ahead of the SP 500 Emini 1.0 D completion.
It is well worth monitoring other indexes for strength or weakness when the same patterns have formed. That analysis can aid traders in entry, stop loss and exit techniques.
On Chart 2, featuring the S&P 500 Emini, I have drawn a horizontal purple line across the RSI highs from the February 2020 highs. This may be an area where the RSI finds resistance with price near or around the completion areas of the pattern.
When trading longer term charts, such as a daily versus intraday, it is very important to learn entry skills, which include combining elements of intraday time frames, momentum indicators and other price patterns to control risk and also, at times, waiting on the sideline until there is confirmation.
There are entry techniques that can be learned and implemented to control risk and monitor the price behavior. We never know what price will do - the only element we can control is the risk.
If you would like to learn more about these patterns and programs to learn to trade them, please visit me at my website www.tradingliveonline.com, or feel free to email me at ljouflas@msn.com.
Best wishes for successful trading!
Leslie Jouflas, CMT