
SPX Monitoring Purposes: Long SPX on 2/22/21 at 3876.50
Monitoring Purposes GOLD: Long GDX on 10/9/20 at 40.78
Long Term SPX Monitor Purposes: Sold long SPX on 1/15/21 at 3768.25= gain 10.80%; Long SPX on 10/26/20 at 3400.97
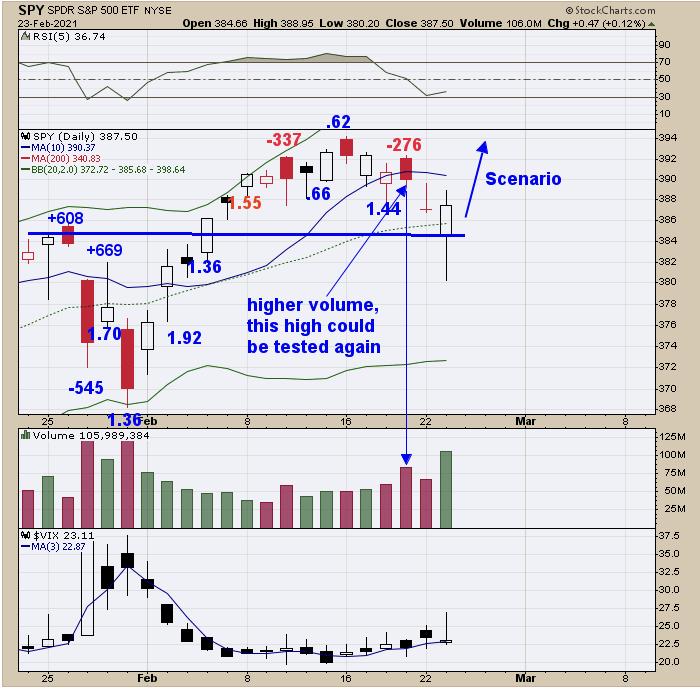
Yesterday, we said "Last Thursday the TRIN closed at 1.44 and Friday the TICK closed at -276, which is a bullish combination and suggests the market will make a low as early as last Friday to as late as this Tuesday." It turns out today may have been the price low, but the closing low appears to have been yesterday. Going into yesterday, the SPX (Not the SPY) closed lower the last five days. This condition predicts the market will be higher within five days 82% of the time with an average gain of .83%. The correlation of the SPX:VVIX suggests this rally may not last (will cover that in tomorrow's report). Don't think a prolonged rally is starting here, but it could rally back to top of the trading range. Long SPX on 2/22/21 at 3876.50.
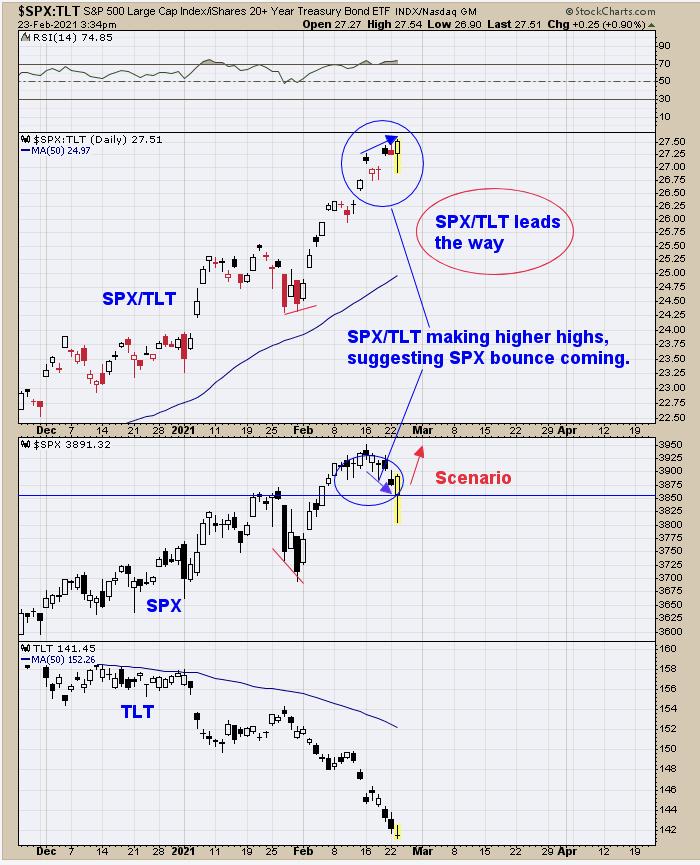
We updated this chart from yesterday, when we said, "It's common for the SPX/TLT ratio to lead the SPX. The SPX/TLT ratio sets near a new short term highs and higher than it was last Tuesday, while SPX made a new short term low today, which is a bullish divergence short term. SPX is probably in a trading range and therefore we don't think this rally may go far, but could test the recent highs." Notice that SPX/TLT is trading at a new high, suggesting SPX may also test or trade to a new high.
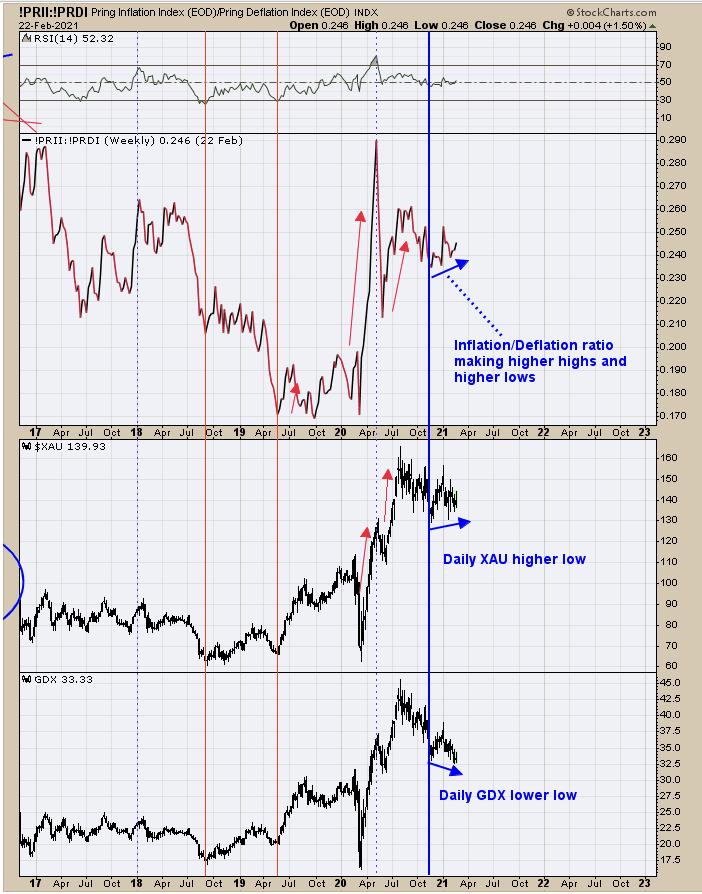
Since the last low in November on GDX (XAU), the Inflation/Deflation ratio has been making higher highs and higher lows. Comparing this to GDX, which has made lower highs and lower lows, a positive divergence is present. Notice also the XAU has made a higher high and higher low from its November low. There was a possibility that GDX may test major support near 30.00 (10% lower) but, with the Inflation/Deflation ratio showing strength, the 30.00 range may not be in the cards. Yesterday's "Sign of Strength" in GDX off a low and testing the February 17 gap on higher volume (bullish) suggests a low could have been made (not shown). It's easy to point to a low after the fact, but there are positive divergences showing up. Long GDX (10/9/20 at 40.78).
Tim Ord,
Editor
www.ord-oracle.com. New Book release "The Secret Science of Price and Volume" by Timothy Ord, buy at www.Amazon.com.