
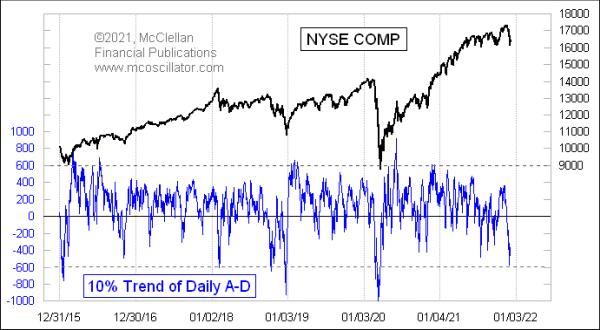
This week's chart is one of many that show the oversold situation that has appeared just recently. The 10% Trend of the daily A-D difference dipped all the way to -579 on Dec. 1, which is officially "pretty darned oversold."
The 10% Trend of daily A-D is one of the components for calculating the McClellan Oscillator. The other is the slower 5% Trend. That percentage reference is known as the "smoothing constant" for the calculation of the exponential moving average. To understand this principle, here is an illustration from some of our old instructional material.
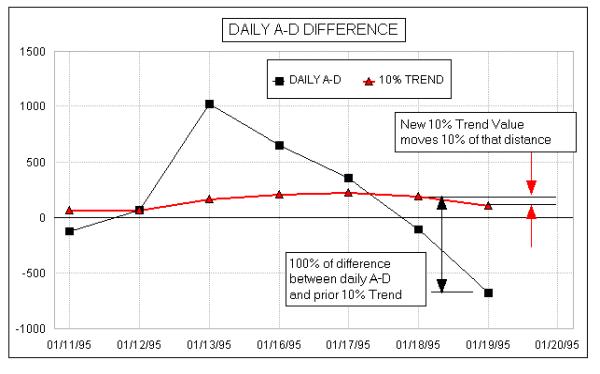
Each day, we calculate the difference between the daily A-D number, also known as the "daily breadth", and yesterday's 10% Trend value. The new 10% Trend value moves by 10% of that difference. So if it is a big difference, the 10% Trend will move more. To get the 10% Trend up or down to a really extreme reading requires a lot of days of extreme daily breadth readings.
My parents, Sherman and Marian McClellan, took up the use of the 10% Trend and the 5% Trend of daily A-D in the late 1960s because they were followers of the late P.N. "Pete" Haurlan. He was an actual rocket scientist at the Jet Propulsion Laboratory (JPL) in Pasadena, California, back in the 1960s, who worked on the gravitational slingshot calculations for getting space probes like Voyager out to the far reaches of the solar system. In his spare time, he coded the JPL computers after hours for tracking stock prices, the first person west of the Mississippi to use a computer for stock market analysis.
Haurlan introduced the world to the use of exponential moving averages (EMAs) for tracking stock prices, a bit of math which had only been first contemplated in 1957. See this for some of the history. He advocated using round number smoothing constants like 5%, 10%, 20%, etc., because he knew that most of his followers were doing their EMA calculations by hand on scratch paper, and using round number smoothing constants made the math easier. He even used the 10% Trend of daily A-D in his Trade Levels newsletter, calling it the "Haurlan Index" without divulging publicly what it was based on. That newsletter would feature the EMA values of daily A-D numbers and other indices on their own.
The key insight that my parents came up with in 1969 was to look at the difference between two EMAs, the 10% and 5% Trend of daily A-D, which came to be known as the McClellan A-D Oscillator. Interestingly, 1969 was also when another analyst named Gerald Appel, in Great Neck, NY, also thought to look at the difference between two moving averages, leading to his "Moving Average Convergence-Divergence" or MACD indicator. There was no communication between them; it was just a little bit of technical analysis serendipity across 3000 miles' distance.
Exponential moving averages respond faster to trend changes than simple moving averages (SMAs). In an EMA, the most recent data are weighted more heavily, whereas in a SMA all data points in the lookback period are weighted equally. See this for more about that difference in calculations.
Turning back to this week's chart, a deep reading like this is a good indication of an oversold condition. But just knowing that the market is oversold is not enough. The market can always get more oversold, if it wants to. And even when an oversold low does matter, it may not be the final word. There can be a relief bounce, followed by even more selling. It would be nice if the market would serve up nice clean answers all the time, but that is not the market we get to play in. It usually takes a 10% Trend reading a lot lower than what we have just seen to mark an exhaustive bottom for stock prices.