From a technical perspective, the StockCharts Technical Rank (SCTR) makes a TON of sense. It's a very quick way to see how a stock is performing relative to its peers (ie, large cap, mid cap, small cap). These rankings are based on technical scores developed by John Murphy and they take into account long-term, mid-term and short-term technical indicators with the majority of the weighting on the long-term indicators. This also makes perfect sense in my view because the longer-term trend is much more powerful and meaningful than its shorter-term counterparts. But the mid-term and short-term do influence the results to a degree. Generally, the stocks with the highest SCTR rankings will boast superior technical results across all time frames. To gain a better understanding of how the SCTR was developed, I'd strongly recommend that you spend a few minutes reading this explanatory ChartSchool article.
I believe it's imperative to understand the technical indicators that you use in your trading. Buying or selling a stock because a line moves one way or the other seems like nothing more than a gamble to me. You need to understand what that line means. For me, many of these "lines" are secondary indications to support or refute what I'm seeing on the charts in terms of price/volume action. I rarely use a "line" or one indicator to buy or sell a stock. For instance, a stock could make a bearish crossover of its MACD centerline, which by itself might be construed as a bearish development. But that same stock may just be approaching a major support level such as the one below:
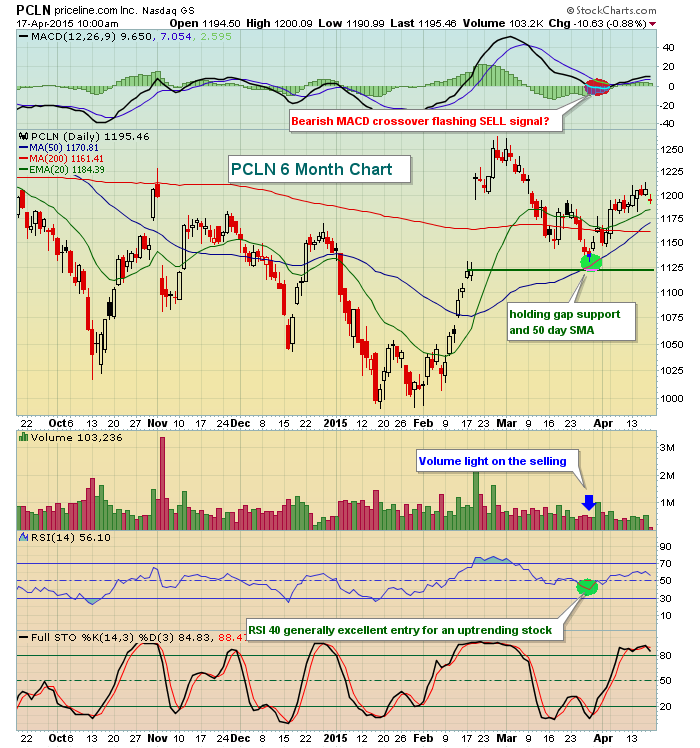
Simply following the MACD line on the priceline.com (PCLN) chart would have resulted in a very poor trading decision. Yes, the MACD line moving below the zero line is a negative development. If major price support had been lost, the MACD would be providing us a confirming signal to sell. But for me, there is nothing more important than the combination of price/volume. Note that PCLN's volume was very low, not the kind that would suggest a major change in trend was taking place. In addition, the RSI - another momentum indicator - was just touching 40 support, which is typically a great level for the RSI when entering an uptrending stock. So my point here is.....UNDERSTAND the lines and indicators on a chart and use them to confirm or refute the primary indication of trend which is price.
With that example in the books, let's get back to the SCTR rankings. I use the SCTR rank to confirm that I am looking at an uptrending (or downtrending in a bear market) stock in a bullish market environment. I'm a momentum trader, not a value investor. Note that SCTR ranks look ONLY at technical price action. There is no calculation for EPS growth, cash on hand, debt to equity ratios, recent product announcements, etc. If you buy based on fundamental analysis alone, the SCTR rank won't apply.
I rarely try to time bottoms in a downtrending stock, I'll leave that for others. Based on my trading style and strategy, I want to ride the momentum of a stock much like a surfer rides a wave. The SCTR helps us to identify the stocks that are riding the waves in. Here's an example of a stock that came out with strong earnings recently and made a significant gap higher to completely change the technical merits of the stock:
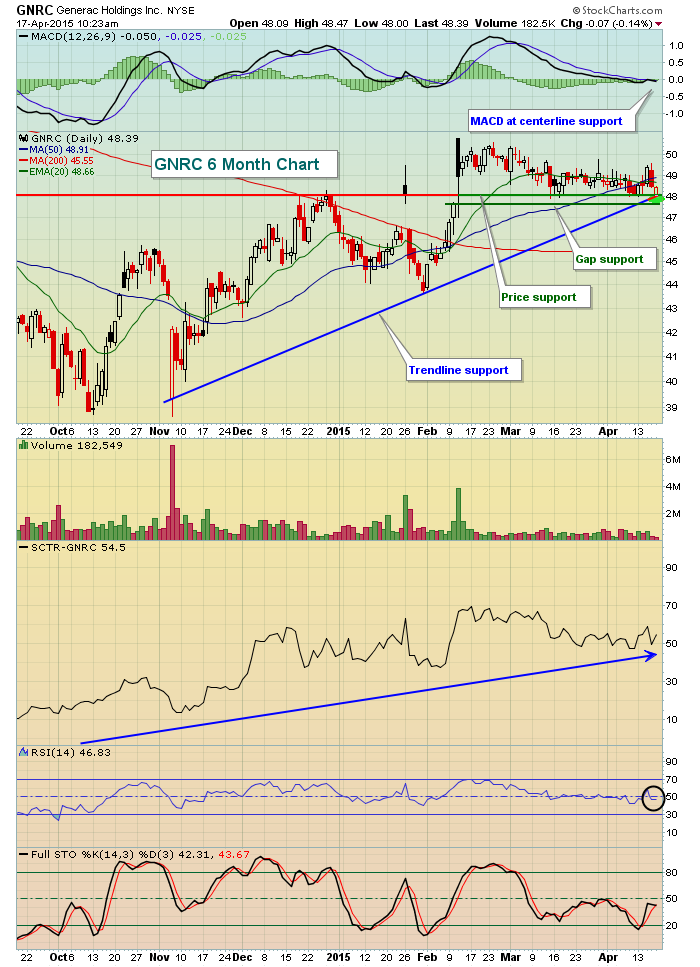
There are a lot of different ways to use the SCTR, but for me this suggests that I have a stock with a consistently rising SCTR relative to its peers while at the same time the stock is holding price, gap and trendline support in the 47.50-48.00 range with a MACD at centerline support and an RSI in the 40s. This won't guarantee us any kind of success, but it clearly indicates the reward to risk is solid on a stock that has an uptrending SCTR rank. If the support level identified fails, we'll likely see the SCTR uptrend fail as well and GNRC's attractiveness as a trading candidate will diminish rather quickly.
Personally I use the SCTR rank as further confirmation of what I'm seeing in terms of price and volume. There are scans you can run at StockCharts to highlight SCTR ranks and I plan to review a couple during my "Trading Places LIVE webinar" at noon today. The webinar is FREE and you can CLICK HERE to register and join me. If you can't make the presentation live, a recorded transcript will be available on the StockCharts.com home page. Scroll to the bottom of the home page and find "What's New at StockCharts" section. Then under "Recent Webinars", you'll find my webinar from April 17th. It should be available within a couple hours of the conclusion of the LIVE event today.
Happy trading!
Tom


