Perhaps one of the biggest mistakes we make is to misinterpret normal stock market rotation as a predecessor to a bear market. During a bull market, money rotates from sector to sector, from industry group to industry group and from stock to stock. Of course there are outperformers throughout a bull market and if we had the ability to use 20/20 hindsight to trade, we'd know exactly where to keep our money, ride the short-term down periods and hold until we're all rich and famous. Lordy, wouldn't that be nice?
Breaking news - it's not that easy.
Fortunately, however, we have our charts and our chart lists here at StockCharts to keep us all sane during the inevitable pullbacks. We can't allow our emotions to take over during bouts of selling. Maybe you feel it's unavoidable to panic when your stock begins to sell. Please just remember that when you enter a trade, you should already have a plan in place. If you don't know where on the chart it makes sense to sell technically, then don't buy it. Period. Trading requires a game plan. I'm a huge NFL football fan. Do you think NFL coaches go into a game without a game plan? They've studied their opponent, know their strengths and weaknesses and already know exactly what they believe will work and won't work before the game ever starts. Many NFL coaches script out the first 15-20 offensive plays of the game beforehand. They do their homework and they're DISCIPLINED. You really need to approach the stock market and your trading in the same fashion. Know your stock's strengths (support) and weaknesses (resistance) before you ever take the field (buy).
Ok Tom, so what does any of this football talk have to do with utilities? Nothing really. It was just an opportunity to reinforce the notion that we must have a game plan in effect. That includes looking at the big picture with respect to sectors. That's where utilities comes into play here. At first glance, utilities is one ugly, broken sector, right? After all, their one month performance of -0.74% is the worst among all nine sectors and their year-to-date performance ranks last too at -6.61%. What's to like?
Well, let's keep a couple things in mind. First, interest rates remain near historically low levels so the high dividend yields will contine to remain attractive to investors looking for income. February's absolutely dismal performance in utilities came at the hand of rising treasury yields. This chart says it all:
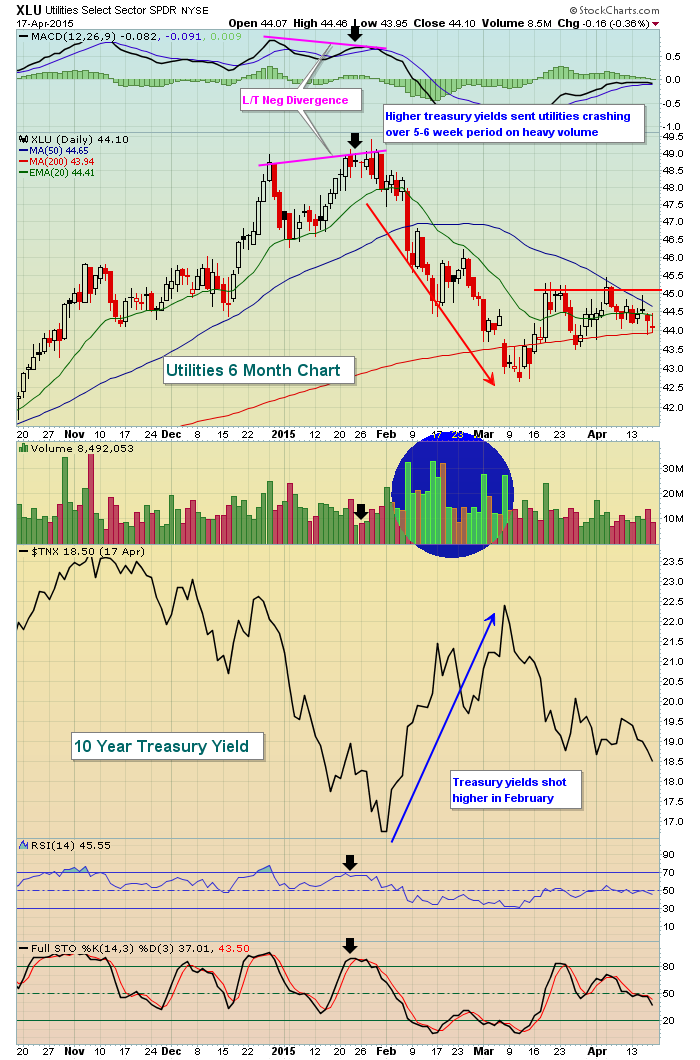
Let's face it, this is an ugly chart, especially compared to all of the other sector charts. So how could I possibly like it? Well, in the short-term I don't. The XLU has been in a downtrend since the January high. The rebound has been on much lighter volume and it continues to fail at the falling 50 day SMA. That has to change for it to be a solid reward to risk trade on the long side.
But a 6 month daily chart only gives us one view - the short-term. When money rotates out of a group in the short-term, of course it'll make the short-term chart look bearish. We have to remember, however, that we're in a 6 year bull market and sectors rotate. Currently, the utilities space is out of favor just as consumer discretionary took a year off in 2014. Consumer discretionary is now the 2nd best performing sector in 2015. Will utilities return to favor as well?
For that, let's move to the long-term weekly chart and look at what the big picture tells us:
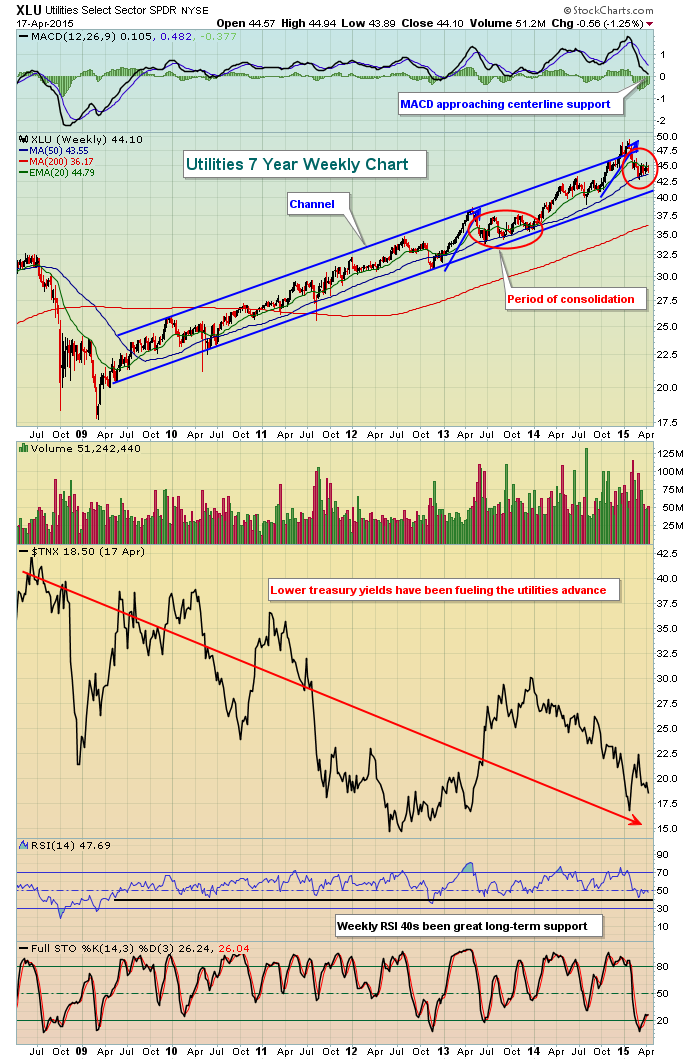
Do you see how taking a step back to look at the bigger picture provides a completely different view. The blue arrows in the first half of 2013 and again more recently show that utilities made a parabolic move to the upside. In 2013, it was followed by months of consolidation to absorb that advance. We're likely in another period of consolidation right now that will be very frustrating to buyers of utilities. It appears to make more sense to me to enter the utilities sector if and when we retest that lower channel trendline, which currently is much closer to 41.00, or 7-8% lower than the current price. The reward to risk will certainly be set up much more favorably at that time.
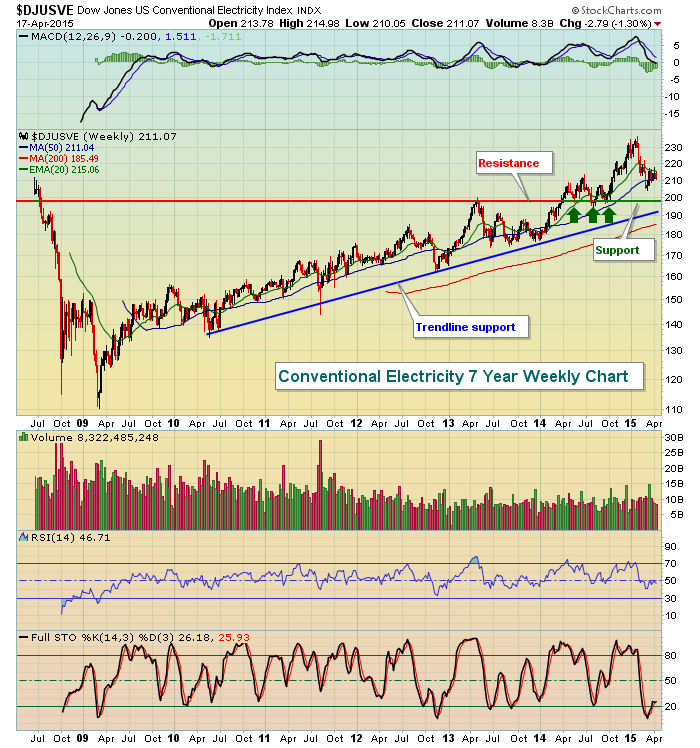
Should utilities consolidate further and work their way back closer to that 41.00 level on the XLU, one industry group likely to benefit would be the Dow Jones US Conventional Electricity Index ($DJUSVE). The long-term pattern remains quite bullish and another 7-8% pullback there would set this group up beautifully from a reward to risk perspective with both price and trendline support converging there. Have a look:
Happy trading!
Tom


