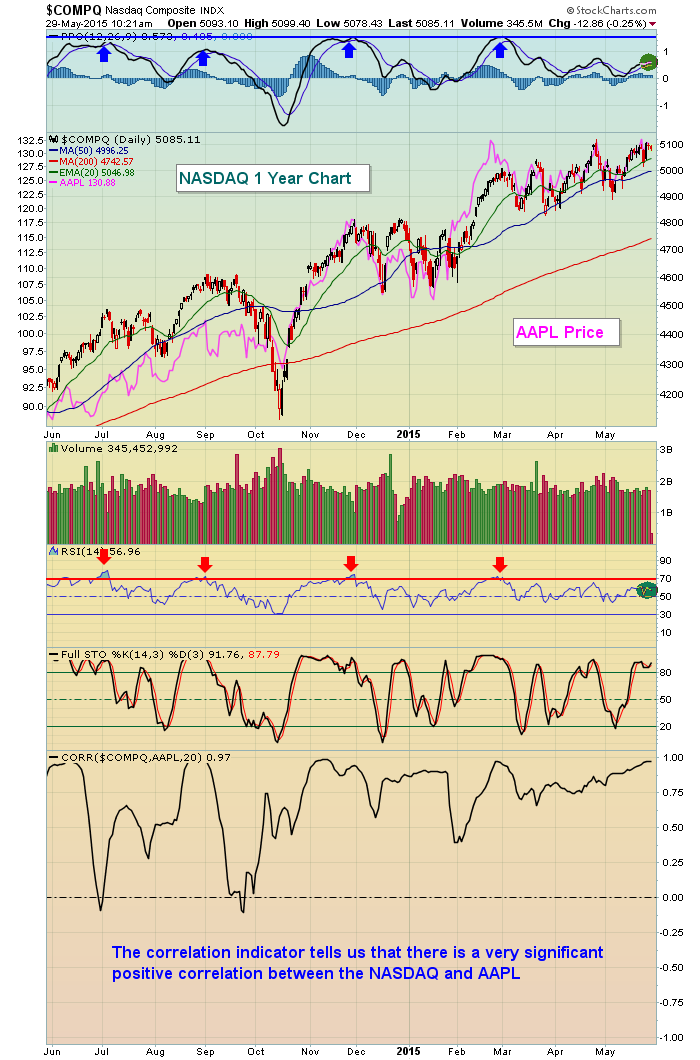
Apple (AAPL) is more than a $750 billion market cap company, by far the largest on the NASDAQ. Therefore, AAPL's price performance will have a rather significant impact on the overall performance of the NASDAQ as the NASDAQ is a market cap weighted index. In other words, AAPL's astronomical valuation plays a more significant role in the direction of the NASDAQ than any other company. The relationship between AAPL and the NASDAQ 100 ($NDX) is similar so if you trade an ETF like the QQQ or one of its leveraged counterparts, you cannot ignore the technical state of a company like AAPL. To illustrate the tight correlation, I will use two methods. First, I'll show AAPL's price BEHIND the price of the NASDAQ. This should give you a very quick visual of how each of them tends to move in unison. It's the pink solid line. Second, I've added the "correlation" indicator which tracks how well any two companies, indices, etc. track one another. A reading above zero suggests there is a positive correlation between the two while a reading below zero would indicate the two move in opposite directions, or have a negative correlation. Check out the chart:

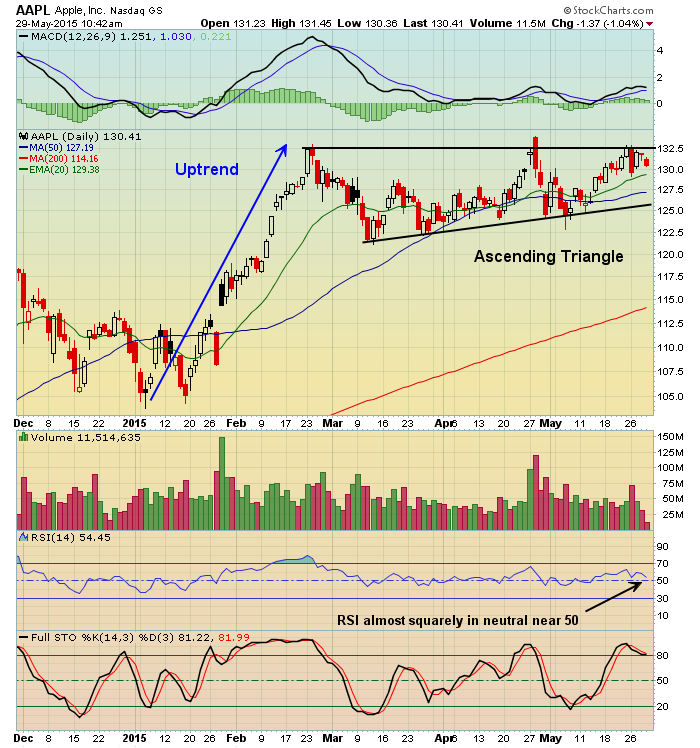
I think both illustrations are quite clear. In this case, AAPL doesn't fall far from the NASDAQ tree. Or maybe it's the NASDAQ that doesn't fall far from the AAPL tree? Either way, it's fairly clear to me that you can't trade one without at least acknowledging the technical state of the other. I would not trade the QQQ, for instance, without first seeing technical confirmation in the AAPL chart. So how do these two look independently? Well, I think they both are quite bullish. Let's first take a look at the AAPL chart:

There's an uptrend in play to open up the first two months of 2015 and AAPL has spent the last three months consolidating those gains in a bullish ascending triangle as it's worked off overbought conditions. We always want our holdings to go up day after day, week after week, but the truth is they need time to consolidate - until a fresh new group of buyers emerge. In the meantime, I expect AAPL to trade within this triangle. If we see short-term weakness in the overall market, we could even see AAPL trade in more of a flag pattern with lows approaching the May lows closer to 120.00. I'd be surprised to see much more weakness than that, however.
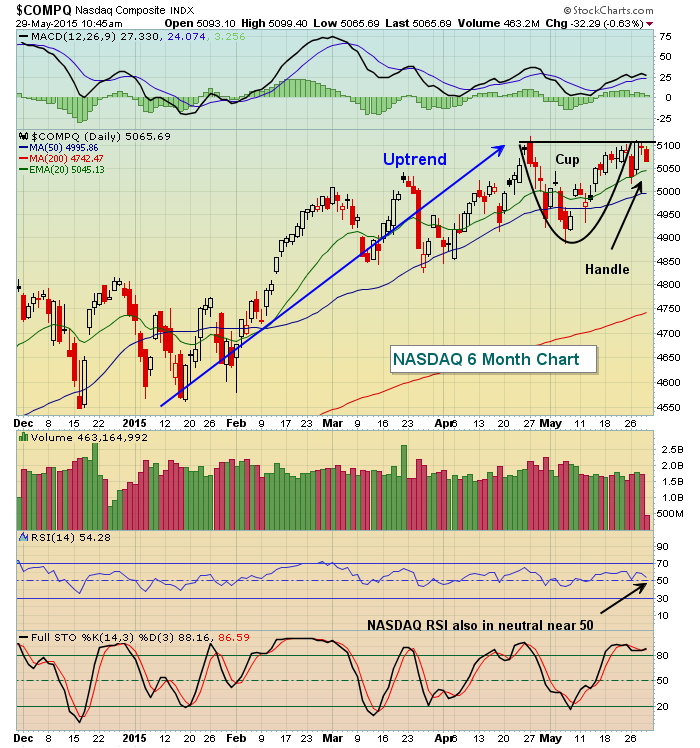
As for the NASDAQ, check out the bullish pattern:

The NASDAQ, off an uptrend, formed a cup recently where its May highs matched the highs posted in late April. The recent selling is printing potentially the handle before a technically significant breakout. The measurement of this pattern is the depth of the cup, or in this case 200 points. Therefore, on a breakout above 5106, I'd be looking for another run to perhaps 5300.
In another hour or so, I'll be hosting my latest "Trading Places LIVE" webinar where I'll delve into the above charts and other indices, sectors and industry groups. I'll follow up on my Wednesday blog and webinar discussion of gaps, discuss Stocks in the News with Bill Shelby, pose another "What Would You Do" question which is an interactive case study with regard to trading, and wrap up with my Free For All Friday where I rapidly review the technical merits of stocks you provide. I'd love to have you join me. It's FREE and simple - REGISTER HERE and I'll see you there!
Happy trading and enjoy your weekend!
Tom


