If you know one thing about me, you should know that I'm a stock market historian. I've logged every day's S&P 500 activity onto an Excel spreadsheet since 1950. If there's a trend, I can tell you about it. So when I hear the blanket statement to "go away in May", the hair on the back of my neck goes straight up. Let me be clear about one other thing. I'm a short-term swing trader. I won't argue that the May through October period produces weaker results than the November through April period because I have the historical facts to prove that argument. In fact, let's start there.
The History: May Through October
Since 1950, the average annual return on the S&P 500 is 9.07%. So by doing a little math, we could assume that in a perfect world the May through October period would produce an average return of 4.585%, or half the annual amount, right? Well, it doesn't. The average return on the S&P 500 from May through October since 1950 is 1.38%, well below what we'd expect. Therefore, that means the cry to head for the hills should be heeded? Hhhmmmmmmm. Let's think about a few more things before we make that call. I did a quick analysis to study the years where the S&P 500 has performed below its average 9.07% return. There were 30 such years since 1950. The average annual return of the S&P 500 during those years was -5.41%. Interestingly, the average return of the May through October period during those same years was -4.67%. In other words, nearly all of the losses during the S&P 500 "below average" years were inflicted by that May through October period. So it's simple then, right? Let's just figure out whether we're in a below average year or a bear market and we'll know whether to "go away in May"! Oh wait, how can we figure out whether we're in, or headed for, a bear market?
Technical indicators and intermarket analysis, my friends.....we'll get back to that in a bit.
The overall performance of May through October is clearly below that of November through April. There's no sense trying to dispute that. It's a historical fact and the above paragraph is difficult to refute. Facts are facts. But remember, I'm a swing trader. I'm looking for short-term opportunities to trade and we're in a six year bull market. Are there any historical tendencies that should give me confidence as a short-term trader?
If you've followed my writings over the years, you know that there are bullish and bearish historical tendencies throughout the calendar month. These tendencies DO NOT CHANGE during the May through October period. For instance, I know that positive money flows and the anticipation of these money flows create VERY bullish historical tendencies for the stock market from the 28th of one calendar month through the 6th of the next calendar month. That's important to know as a trader, particularly an options trader where time is of utmost importance. Here is a historical fact: Nearly all of the S&P 500 gains since 1950 have been made during this 10 day period of the month. Put another way, all of the S&P 500 gains have been made in 33% of the calendar month. That's a pretty astounding FACT that goes back 65 years, certainly a representative sample in the mind of nearly every statistician.
During the months of May through October, these bullish historical tendencies remain. Here are the annualized returns on the S&P 500 by day of the month for the ENTIRE YEAR (all months), followed by the annualized return of these calendar days during the May through October period:
28th: +20.21%, +35.07%
29th: +19.63%, +13.39%
30th: +11.82%, +22.49%
31st: +33.95%, +26.17%
1st: +46.63%, +45.74%
2nd: +38.35%, +34.50%
3rd: +26.53%, +19.43%
4th: -0.23%, -16.51%
5th: +30.09%, +20.97%
6th: +16.39%, +18.94%
Cumulative, 28th through 6th: +24.05%, +22.57%
There really isn't much of a dropoff in performance on the S&P 500 during these bullish calendar days from May through October. That's why, as a trader, I find much of this "go away in May" talk to be pointless. I'm trying to find short-term trading opportunities and history is telling me that I should still be able to find those opportunities during the summer months as well. I will throw out this word of caution. The 19th to the 27th of the calendar is generally quite weak, at least from a historical perspective. That weakness is exacerbated by the May through October period. In other words, based upon history, it probably makes sense to take trading profits much quicker in the May through October period as mid- to late-month historical weakness very well could tear apart your early month gains.
Evaluating The Technical Health Of The Market
The May through October period is considerably weaker during years in which the S&P 500 underperforms. But we don't know how the S&P 500's performance will stack up until December 31st. So how then can we possibly know what to do on May 1st?
It's all about the technical health and outlook of the stock market. This doesn't provide us any guarantees, but it helps us to manage risk. There are common traits of a bear market or uncertain stock market. Money begins to flow to defensive areas of the market on a relative basis like utilities and consumer staples. So as we head into the summer months, one question I always ask is "what is leading the stock market higher?" Within consumer stocks, which group is performing best - discretionary (aggressive) or staples (defensive)? Are transportation stocks holding up on a relative basis vs. utilities? How are the small caps (Russell 2000 - aggressive) performing relative to the S&P 500 (less aggressive)?
Most of my analysis comes to the conclusion that this bull market has not ended and is showing few signs of ending. Therefore, my tendency is to ignore the "go away in May" mantra and focus on the technical outlook instead.
Here is a chart with a few different relative performance signals that suggest this bull market will continue:
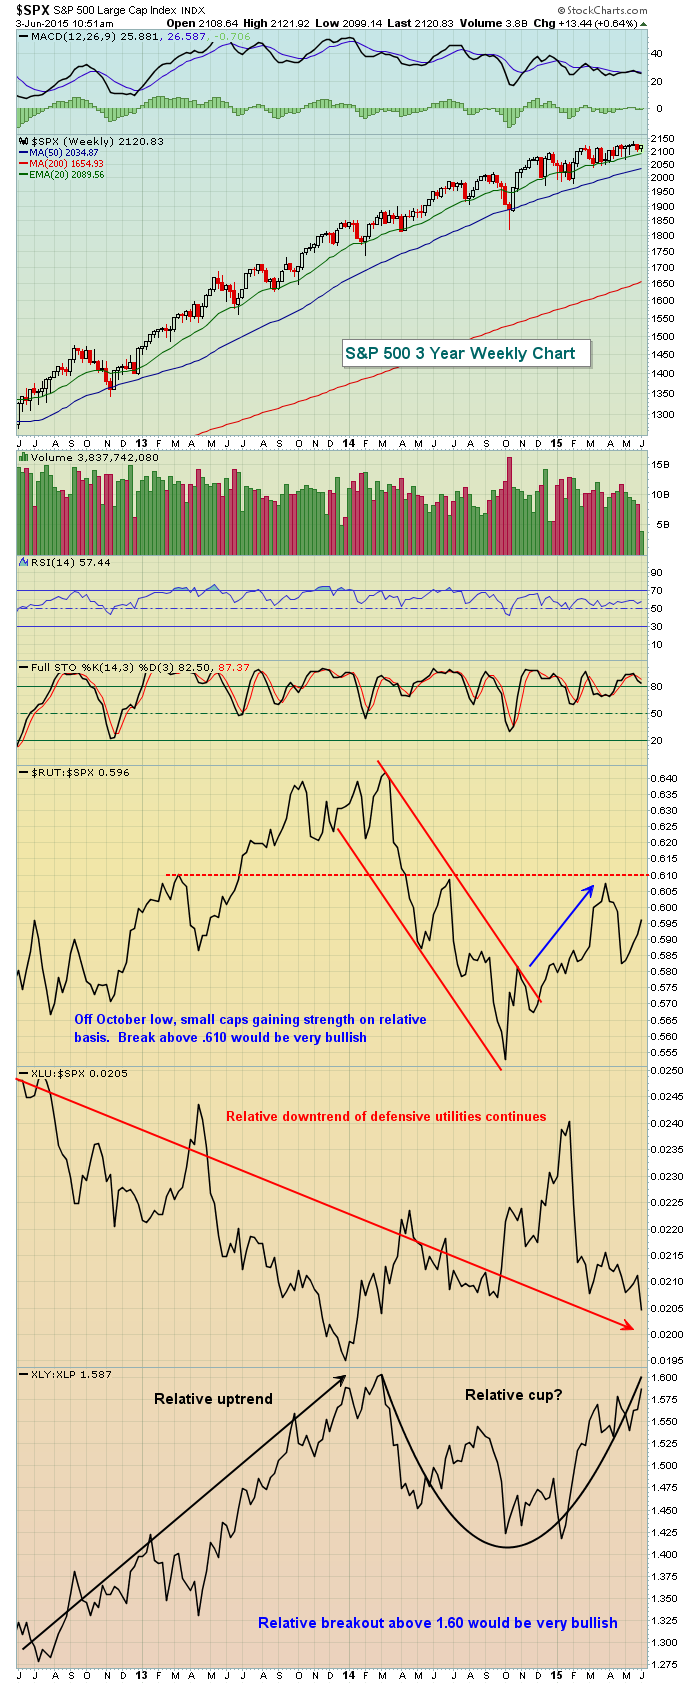
This chart guarantees us nothing, but it just doesn't look to me like this bull market run has ended. I do think the summer could be choppy, but I'd continue to look for periods of strength, especially during the 28th to 6th period that I discuss so often. Money flows do drive stock prices higher. Option expiration later in the month tends to keep a lid on prices.
I'll discuss more of this today during my "Trading Places LIVE" webinar starting at noon EST. Please join me if you can by REGISTERING HERE. And don't forget to subscribe to my blog to the top right of my article. Enjoy your Wednesday and....
Happy trading!
Tom


