One of the advantages that the technical trader carries in his/her back pocket is the ability to visualize the future price action before it happens - based on the prior price action. Trending price action to the upside is generally followed by bullish continuation patterns. Periods of consolidation can be very frustrating because you expect the uptrend to continue for days, weeks, sometimes even months, when in reality we need to allow leading groups to pause and reload for their next breakout. I enjoy following the sectors and industry groups on a daily basis, trying to identify those groups that are poised for another leg in their rally based on breakouts of key technical patterns. The idea is similar to the surfers who are trying to catch that perfect wave to carry them to shore. If you catch it just right, it's an exhilarating feeling - and quite rewarding too.
Below are a few of the industry groups that, in my opinion, are pausing in consolidation patterns and awaiting their next day in the sun.
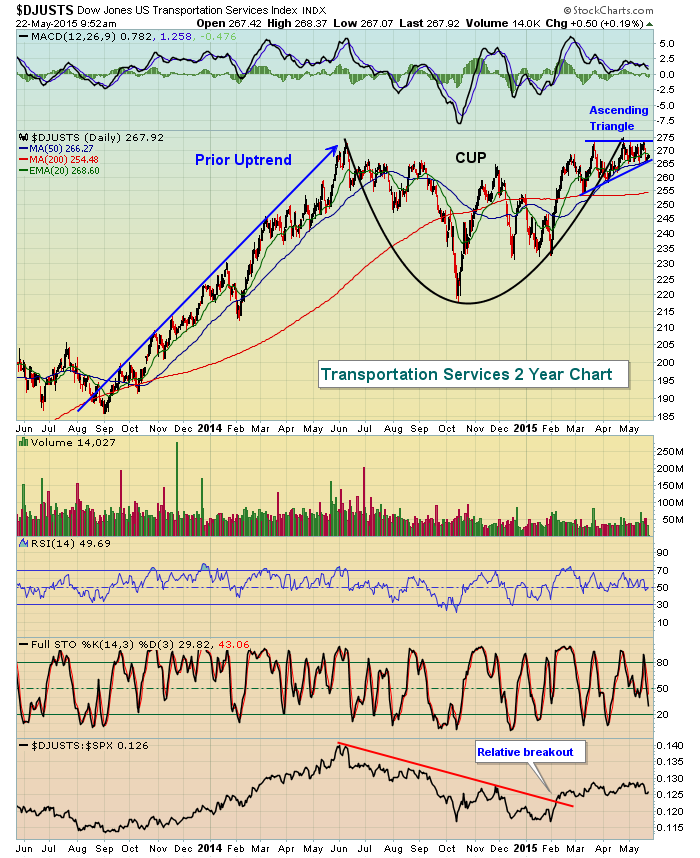
1. Dow Jones U.S. Transportation Services ($DJUSTS)
The DJUSTS hit its all-time closing high of 272.46 on June 9, 2014. Since that time, it's traded above 272.46 on an intraday basis 8 times with one solitary "breakout" on Monday when it closed at 272.56 - not exactly the breakout we're looking for. Because the DJUSTS has been trying so hard and for so long to clear price resistance, an eventual breakout would be quite meaningful technically and we should be prepared for it when and if it occurs. This is an industry that has not participated in the S&P 500 rally. On June 9, 2014, the S&P 500 stood at 1951. It's risen nearly 10%, leaving transportation services in the dust. That doesn't mean that the DJUSTS isn't deserving of your capital. It just means it's not deserving of your capital YET. A breakout could quickly provide the "fuel" for the next leg higher in this transportation space. Check out the two bullish patterns in play here:
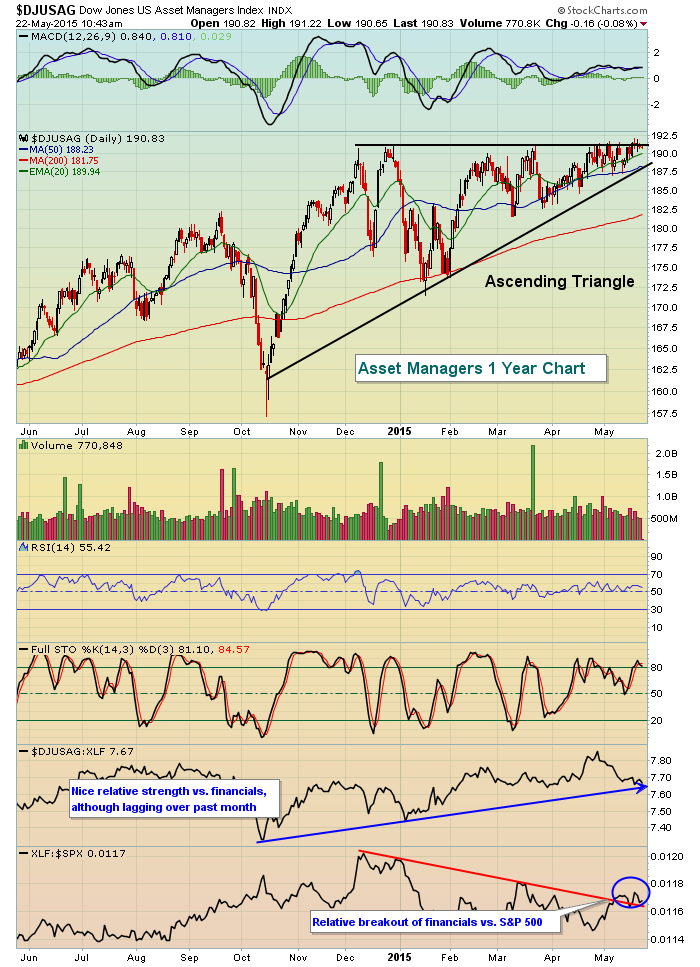
2. Dow Jones U.S. Asset Managers Index ($DJUSAG)
Unlike the DJUSTS, the DJUSAG doesn't enjoy a longer-term bullish continuation pattern, but on the daily chart, it's fairly easy to see that the wait for breakout has been extremely frustrating. The good news, however, is that the financial sector is the third best performing sector over the last week, month and three month periods. Any time the financials as a whole are enjoying relative success, it's going to make me more bullish with regard to the overall market. Despite the relative strength in financials, though, the DJUSAG has been a relative laggard within the financial sector over the past month as we continue to see failure at key price resistance. It is at relative trendline support vs. financials (XLY), so I would expect relative outperformance from here - especially if we see a breakout of this bullish ascending triangle formation. Financials appear to have broken out relative to the S&P 500 this month and that adds to the bullish picture. Here's the chart:
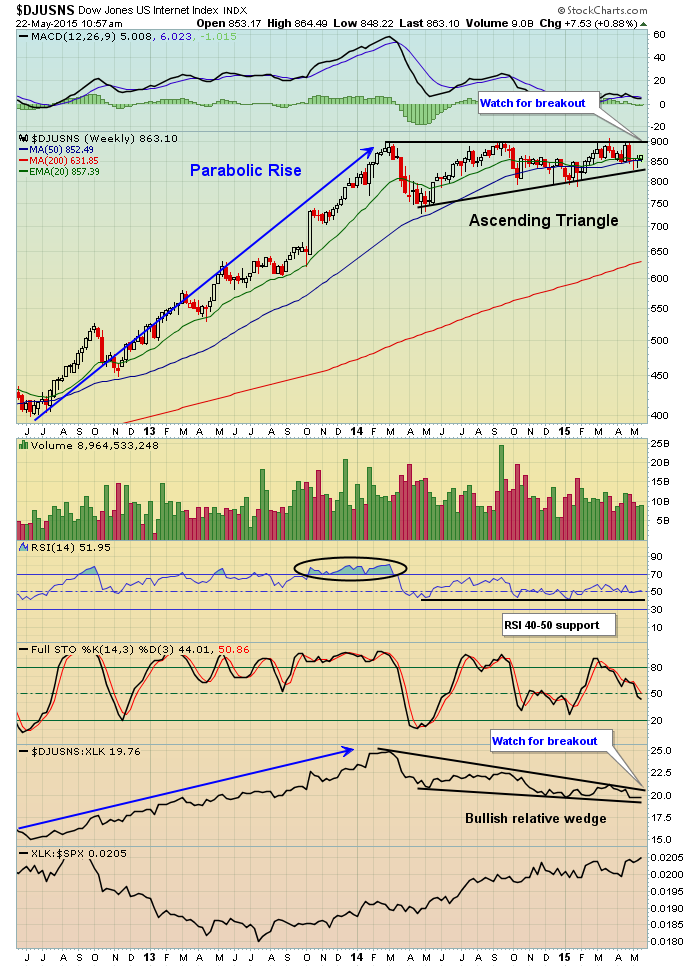
3. Dow Jones U.S. Internet Index ($DJUSNS)
Anyone trading internet stocks probably thinks I'm crazy right about now. How could I possibly favor internet stocks when their index set a high of 900 in February 2014 and now resides at 863? Talk about underperformance! Well, just keep in mind that money rotates during bull markets. The DJUSNS was a STAR performer from 2012 through early 2014 with a parabolic rise that trounced the S&P 500. We have to give groups like this an opportunity to rest and consolidate for awhile, relieving overbought oscillators. That's exactly what the DJUSNS has done for the past 15 months. On the chart below, you'll see that weekly RSI was in the 70s and 80s for 4-5 months at the very top in February 2014. But the recent consolidation in a VERY bullish ascending triangle has relieved those overbought conditions and now weekly RSI is near 50 - a much, much better level if the DJUSNS makes a breakout. Also, note two relative strength conditions. First, the DJUSNS is in a bullish relative wedge vs. technology (XLK). And that is within the confines of a very strong technology sector relative to the S&P 500. Given the fact that technology is in favor among traders and investors, a breakout in the internet space would likely be very well received. Take a look:
These are just three examples of significant technical developments taking place under the surface of the U.S. stock market. These three industry groups also reside in "risk on" areas of the market - industrials, financials and technology. Money flowing into "risk on" areas to confirm breakouts of bullish technical patterns would likely lead to more inflows in these areas, most likely creating great opportunities in individual stocks within these corners of the market.
If you can, please plan to join me in my noon EST webinar today. I plan to discuss the above charts and show you how you can use the features here at StockCharts.com to identify strong trading candidates in these industry groups to boost your portfolio. It's simple. Register here and I'll see you at noon. Also, please subscribe to my blog to the upper right of this article. You'll see "Subscribe to this Blog". Click on "Email updates". Type in your email address and hit SUBSCRIBE. Bingo! You'll receive all of my articles the second they're posted. Enjoy and send me comments and suggestions if you'd like. Some of those comments do become blog articles. :-)
If you can't make the webinar today, just be sure to check out the recording which should be available an hour or two after the webinar ends. These recorded webinars can be found under the "What's New at StockCharts" section of the website on our home page.
Happy trading!
Tom


