We've been in a six year bull market where most stocks have been trending higher. But not every industry group and stock follows the primary trend higher. In fact, catching a falling stock just as it hits rock bottom can provide a big lift to your portfolio. So we're always trying to find that stock or four that could be in a bottoming pattern or phase. I thought I'd take a stab at providing four stocks that I believe COULD be forming a bottom. Technically, there's much work to be done, but let's take a look at them one at a time:
1. Tribune Media (TRCO):
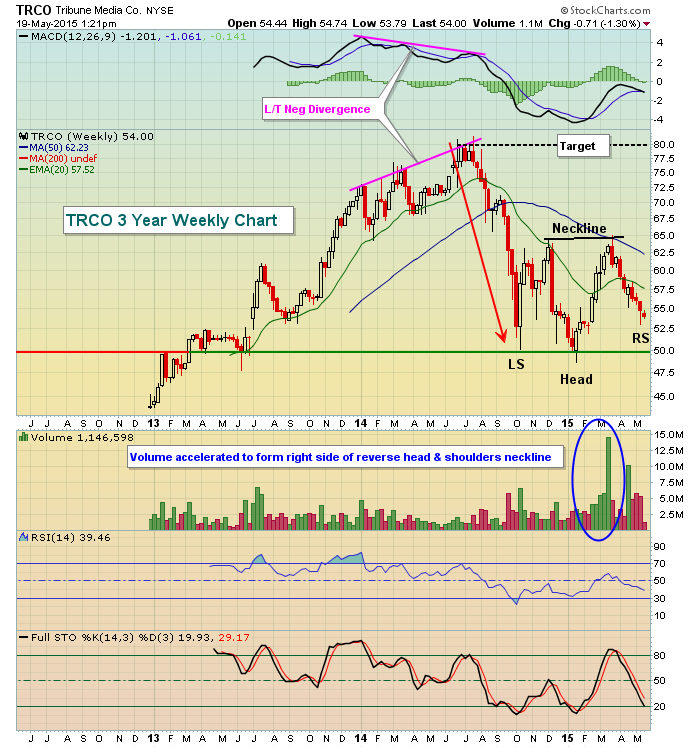
TRCO has been traded publicly for approximately 2 1/2 years and was in an uptrend until slowing momentum became a significant problem in mid-2014. You can see prices pushing higher throughout the spring and summer months - with a declining MACD. Also, check out the slowing volume in the summer months as prices kept trying to push higher. TRCO was set up to fail at that point and it has failed ever since. However, the technical picture has improved despite the apparent free fall the past couple months. TRCO is in the process of printing a reverse head & shoulders pattern, a potential bottoming formation. An eventual breakout above 65.00 on increasing volume would confirm the pattern and set a target measurement of 80.00. In the meantime, an aggressive strategy for entry would be in the reverse right shoulder from the current price down to perhaps 50.00 with a closing stop beneath the reverse head that formed in early 2015. Volume was quite strong as TRCO surged to print the right side of the neckline.
2. Las Vegas Sands (LVS)
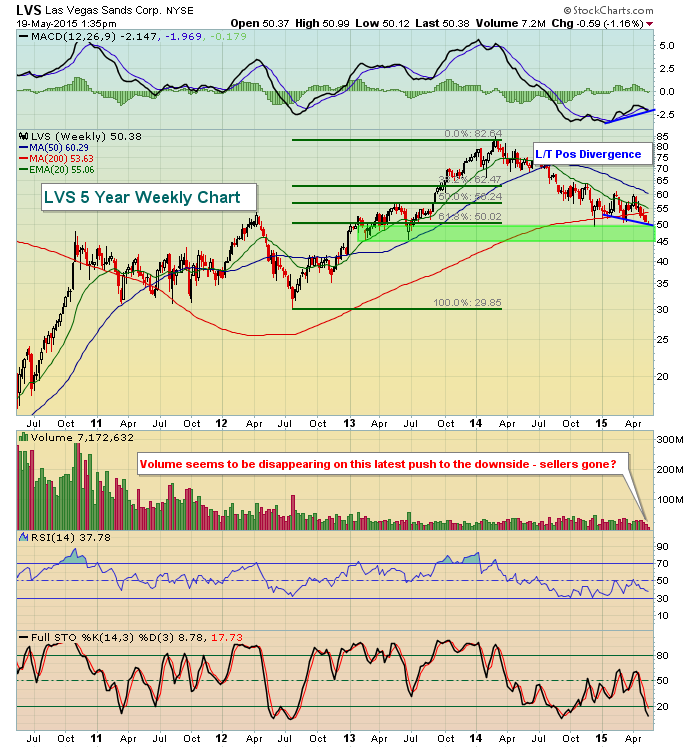
LVS still resides in a longer-term primary uptrend, but I doubt you'd call it that if you owned it the past 15 months. It's been down, down and more down. The good news, however, is that the selling could be reaching its end. Volume has been very light on the recent selling and a long-term positive divergence has emerged on the longer-term weekly chart. Throw in the Fibonacci retracement support level of 61.8% at the top of price support and it's easy to see how LVS could be setting up for another advance. Not shown here is the long-term weekly chart of the Dow Jones US Gambling Index ($DJUSCA), which also reflects the same long-term positive divergence on its weekly chart. I'd be looking for a bounce to at least test recent highs near 60.00. That happens to coincide with the declining 50 week SMA, currently at 60.29. A bounce seems to be "in the cards".
3. Constellium (CSTM)
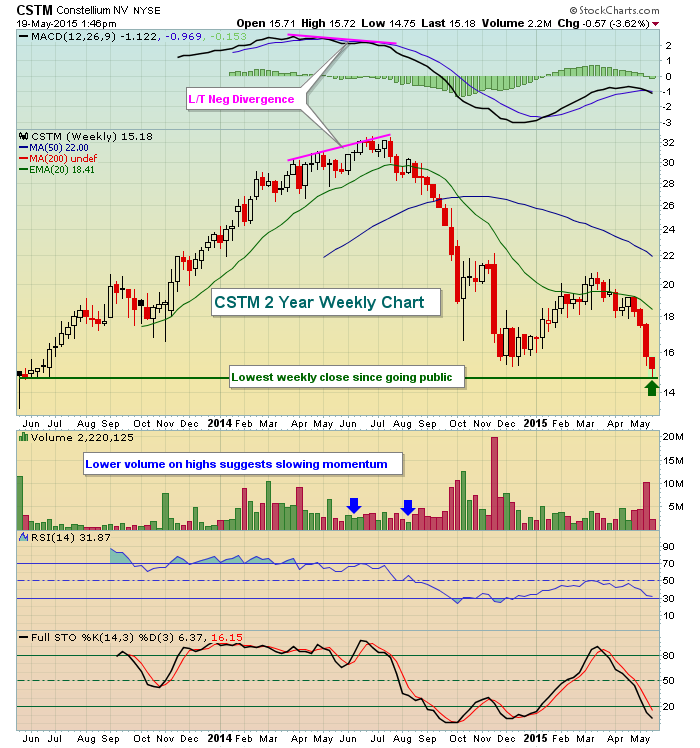
CSTM has been selling off hard for the past two months and has now reached a technical support level where it should begin to attract technical buyers. After its IPO in 2013, CSTM did not see a weekly close below 14.70. CSTM has lost more than half its market capitalization in the last 10-11 months, after setting all-time highs on low volume and with a long-term negative divergence present. That encouraged much selling over the next few months and the downward momentum never really diminished, except for the first couple months of 2015. The 14.00-15.00 area is a rock solid support zone that needs to hold. If it does, a quick recovery to 20.00-21.00 to challenge recent highs and a declining 20 week EMA is a definite possibility.
4. TiVo, Inc. (TIVO)
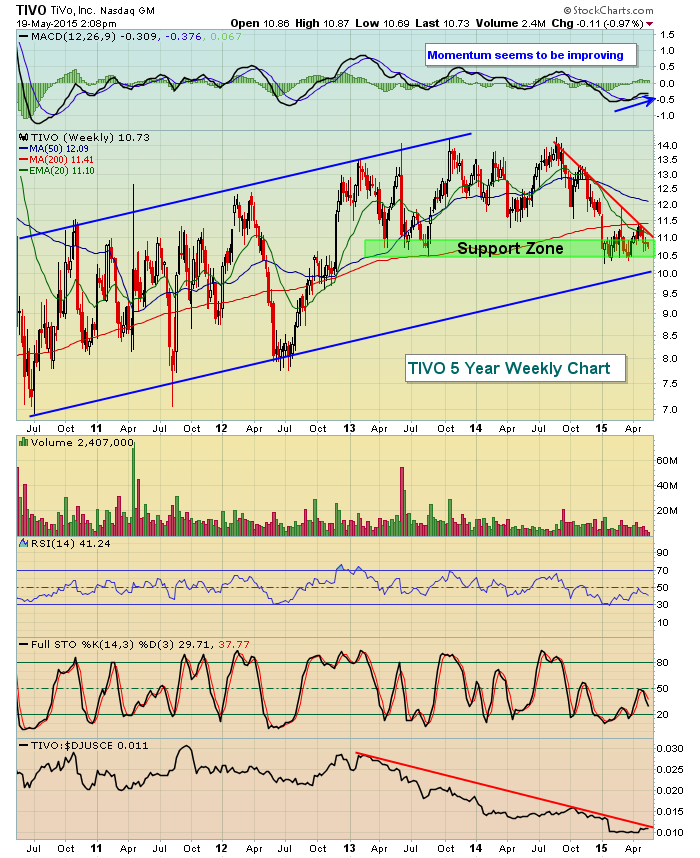
From a longer-term perspective, TIVO actually remains in an up channel, but you'd have a hard time convincing longs of that, especially since the top was set in late summer 2014 just above 14.00. Not only has the stock been under pressure, but it's been badly lagging the consumer electronics space, as can be seen at the bottom of the chart. The good news is that the Dow Jones US Consumer Electronics Index ($DJUSCE) could be primed for a bounce as I outlined in my ChartWatchers article from over the weekend. If the DJUSCE begins to outperform and TIVO can manage to break its recent relative downtrend line, this could be a very good performer over the next few months, so it'll definitely be worth keeping an eye on. There's also an absolute downtrend line in play with price peaks at 14.00, 13.25 and 11.50 connected. A break above that downtrend line would also carry bullish implications. Finally, the 10.50-11.00 area has marked a solid price support zone for more than two years. I'd expect to see this area of support continue to hold - until it doesn't.
Happy trading!
Tom


