I love technical analysis. I spent two decades in public accounting, was a prinicipal in a large regional CPA firm in the Washington DC metropolitan area and audited companies in several industries, including banks. But as I say over and over again, you can have the financial statements and review them all you want. Just please give me my charts.
That doesn't mean I blindly follow technical indicators, however. There are times when you must use sound judgment to interpret what these indicators are telling you. They have limitations. Don't always trust the "line going up or going down". Get to know the indicators you use, understand their formulas and figure out their limitations. My #1 indicator, without question, is the combination of price and volume. It's very difficult to misconstrue. If price/volume is telling me to go long, I'm going long. Other indicators may play a role in managing my risk. For instance, if Apple (AAPL) breaks above a key resistance level on solid volume, but a negative divergence resides on the MACD, I won't hesitate to buy AAPL. But I may use a tight closing stop under the breakout level because a negative divergence is in play. I think it's important to have a hierarchy of signals. Follow your primary signal or signals and use other indicators to keep you grounded and to help manage risk.
In my webinar on Wednesday, I discussed limitations using the Accumulation/Distribution Line (A/D) and On Balance Volume (OBV). Let me start with the A/D. First, here is the formula:
(C-L) - (H-C)/(H-L) where
C = Close, H = High and L = Low for a given period.
Two things are missing from this formula. First, volume plays no role whatsoever. It's difficult to completely gauge momentum using this indicator without considering volume. It's one of the major drawbacks to using the MACD, RSI and stochastic as well. Volume isn't considered in any of those formulas. The second piece missing in the A/D calculation is the prior day's close. So when a stock has big news and sees a major gap higher or lower, the A/D indicator ignores it. GoPro (GPRO) is a nice example of how the A/D line can be very deceiving if you don't understand these two limitations. Check out the chart:
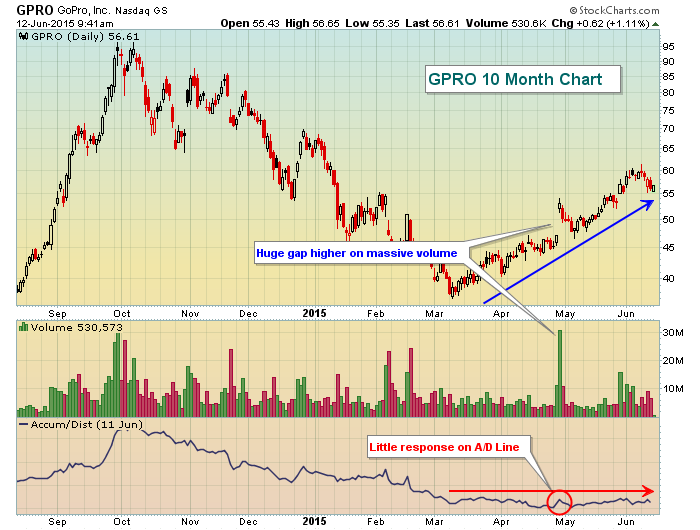
If you look at the action beginning with the second week of March, it's fairly obvious to me that GPRO uptrend is supported by heavy volume along the way. If I didn't see the A/D line, my assumption looking at the chart would be that GPRO is under accumulation. Pullbacks would have represented solid entry levels, yet if the A/D line was your primary indicator it might give an incorrect signal that GPRO was not under any accumulation and you should avoid it at higher prices. The reason for this incorrect signal, however, is that both volume and gaps are excluded from the formula for the A/D line.
Now let's take a look at this same GPRO chart, but this time with OBV as a guide to momentum. Have a look:
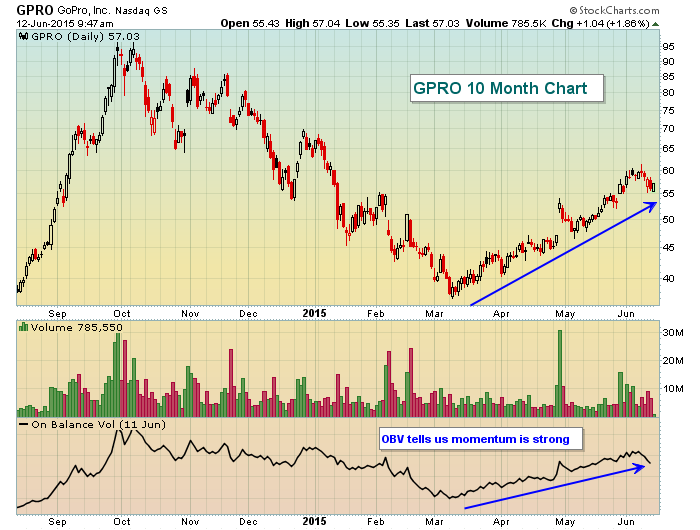
OBV has a very simple calculation. If a stock finishes higher today than it did yesterday, the entire volume is added to the prior day's OBV calculation. If a stock finishes lower today than it did yesterday, the entire volume is subtracted from the prior day's OBV calculation. It's an all or nothing mentality. The good news is that gaps matter. It's also good news that volume matters. Both are taken into consideration using the OBV. But the limitation here is that it doesn't matter if a stock is up one penny or twenty dollars, the same amount of volume will be added to the OBV. In other words, a stock could be up one penny on half its daily average volume or twenty dollars on 100 times its daily average volume and the calculation is the same. Momentum, at least to some degree, should be based on how much or how little price is moving. The OBV doesn't care about that so OBViously can be misleading at times as well because of this shortcoming.
In future articles, I'll address the limitations of the MACD, which is my favorite momentum indicator. In the meantime, I'll give a quick tutorial during today's webinar on how I use the MACD in my daily trading to help manage my trades - entry points, exit points, stops and targets. If you're interested, please join me by REGISTERING HERE. It's free! Also, please subscribe to my blog and receive all my articles the moment they're published. It's simple to do - just look to the right of my blog article for "Subscribe to this Blog". Click on "Email updates". Type in your e-mail address and hit the "Subscribe" button. It doesn't get any easier than that!
Happy trading!
Tom


