The ten year treasury yield has surged from 1.65% to 2.40% since February 1st so it should be no surprise that the Dow Jones U.S. Bank Index ($DJUSBK) has risen more than 14% during that same span. From a sector perspective, the consumer discretionary (XLY) space is the only one that has outperformed financials (XLF), 8.65% to 7.22% as treasury yields have spiked. The fact that two aggressive areas of the market are leading during this rise suggests that traders and investors are much more excited about the prospects of a strengthening economy than they are worried about higher interest rates. So long as this continues, I'm going to trade what I see - which is the likelihood that equities are heading higher during the balance of 2015, not lower.
I do still expect the market to be choppy, however, with potentially scary periods of selling and rising volatility. During those periods, though, it will be important to watch the rotation of money in the various sectors. Normal profit taking and rotation is completely different than full distribution of equities with massive breakdowns at the start of a bear market. It's much too early to begin predicting the latter.
But interest rates do have a significant effect on how money rotates and it's important to understand which companies will benefit from higher treasury yields. Since February 1st, it's obvious to me that banks are among those that will benefit. Before I talk about specific banks, take a look at how banks respond to the changing interest rate environment:
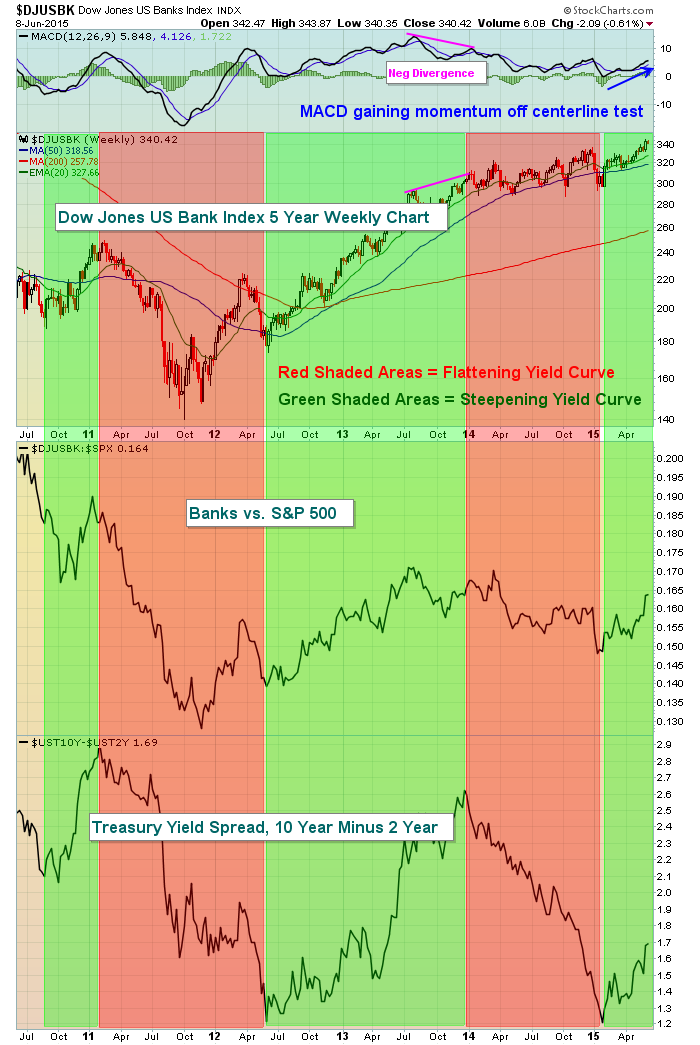
The yield curve is very important to the bottom line of banks. As the yield curve steepens (long-term treasury yield moves higher FASTER than the short-term treasury yield), the Net Interest Margin - a key metric for bank earnings - increases. Higher profits = higher stock prices. Thus, you can see that banks perform very well as the yield curve moves up (green shaded area). A flattening yield curve (spread between the long-term treasury yield and short-term treasury yield narrows) hurts bank profits and the red shaded areas above illustrate how banks underperform during such periods. The performance shown for the two shaded colors isn't coincidence. This relationship makes perfect sense and you can benefit financially from understanding how banks perform during each distinct interest rate environment.
Clearly, the questions become "do you believe the U.S. economy will continue to strengthen?" and "will long-term treasury investors continue to flee?" If you answer yes to both of those questions (and I do), then you'll want to have exposure to banks. An easy way to participate is simply via an Exchange Traded Fund (ETF) that owns a basket of bank stocks - like the KBE (money center banks and leading regional banks) or KRE (regional banks). Recently, the largest holding in both of these ETFs is Bank of the Ozarks (OZRK), which is one of the top three banks technically that I'd be interested in. Check out the chart:
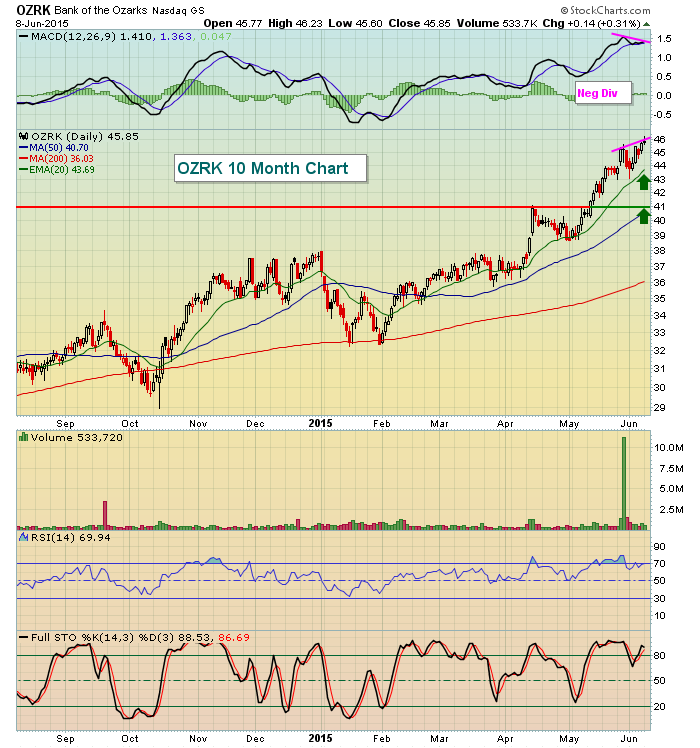
OZRK has been a great performer, but it is overbought technically in the near-term and its most recent breakout was accompanied by a long-term negative divergence. The two green arrows provide potential entry levels during a bout of selling to help manage risk.
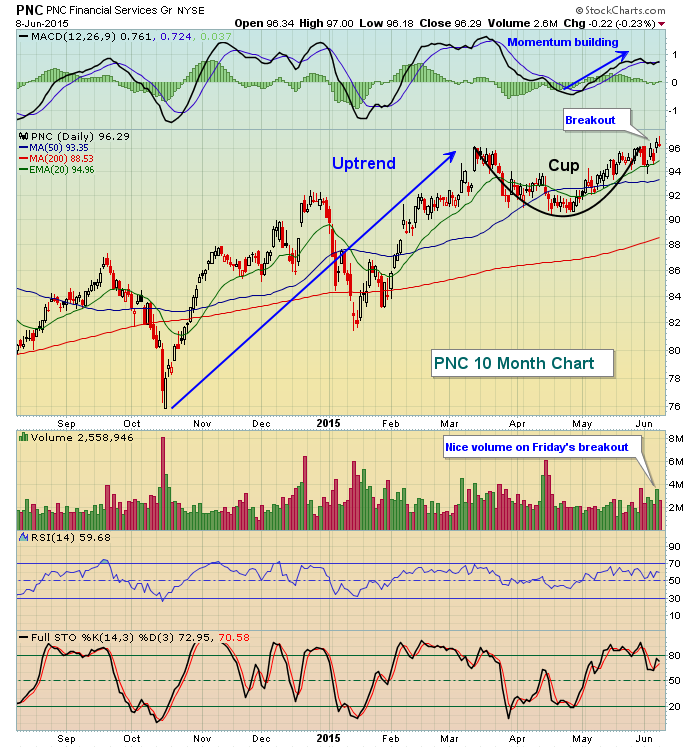
The second bank candidate I'd look at is PNC Financial Services (PNC). Here's the current chart:
Finally, the third bank that appears to be technically strong is Comerica (CMA). While CMA has yet to clear its high from late 2014 which is potentially detracting from a shorter-term perspective, the longer-term weekly chart argues much more bullishly in a potential inverse head & shoulders pattern. Check it out:
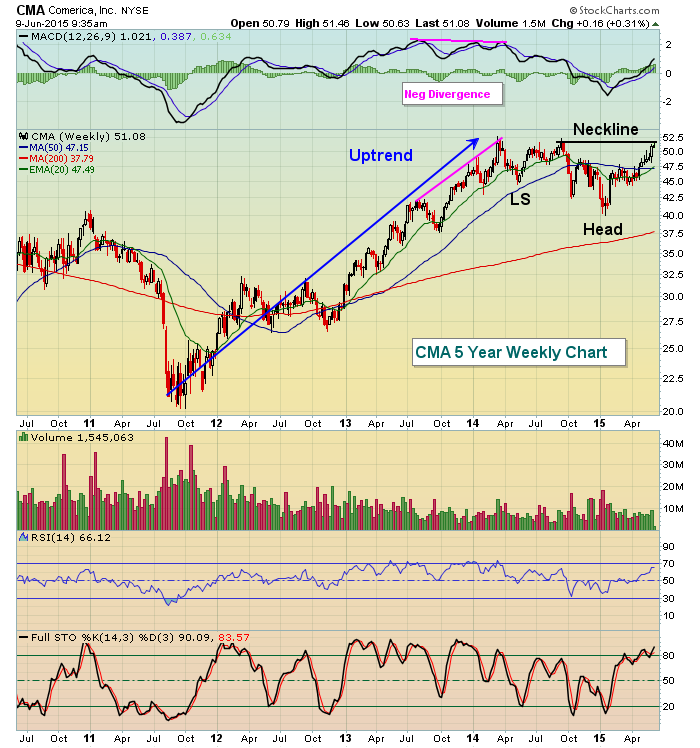
On the surface, it appears as though CMA has underperformed the past several months and there's some truth to that, but given the long-term negative divergence and overbought conditions that existed in early 2014, it certainly made sense technically for CMA to consolidate for a period of time. The current pattern appears to be a bullish inverse head & shoulders pattern with a pullback to test the rising 20 week EMA an ideal reward to risk spot for entry. An argument could also be made for a possible cup formation the past nine months with a developing handle the time to buy. Either way, CMA seems poised to benefit from higher treasury yields as are both OZRK and PNC above.
Please join me on Wednesday for my "Trading Places LIVE" webinar where I'll discuss in much more detail the likelihood of higher treasury yields and additional bank candidates to benefit from rising rates. CLICK HERE to register. It's simple and FREE! Hope to see you there!
Happy trading!
Tom


