I want to start this article from a historical perspective. I'm convinced there's much truth in the numbers. The 28th through the 6th and the 11th through the 18th are historically bullish periods of the calendar month. I believe much of this strength has to do with money flows and the anticipation of those money flows. From my auditing days in public accounting, I know many companies collect 401(k) withholdings from employees and send them off to the Vanguards of the world. Many of these employers have bi-monthly payrolls that generally fall in the middle and end of the month. That wave of money flow into the stock market takes prices higher for a few days and portfolio managers and market makers are buying ahead of these inflows - legalized frontrunning if you will. This accounts for much of the strength during these two periods of the calendar month - all in my opinion of course.
From history, I already know that the 11th through the 18th of the calendar month performs well. I thought I'd take this knowledge one step further and determine what kind of returns we see from the 11th through the 18th during the initial months of quarterly earnings season - January, April, July and October. Here are the results:
First, keep in mind that the S&P 500 has an average annual return of approximately 9% since 1950, or over 65 years. The S&P 500's annualized return by four different periods of the calendar months is summarized below:
28th - 6th: +24.05%
7th - 10th: -6.63%
11th - 18th: +13.68%
19th - 27th: -4.82%
These are the annualized returns for each calendar period for ALL calendar months. The annualized returns for these four calendar periods just during those initial months of quarterly earnings season, or January, April, July and October are as follows:
28th -6th: +37.19%
7th - 10th: -3.63%
11th - 18th: +18.75%
19th - 27th: -8.99%
The gap in performance only seems to get wider. The average return from the 11th through the 18th during January, April, July and October jumps to 18.75% and this is more than double the average annualized return of roughly 9% on the S&P 500 since 1950. This covers nearly 1500 trading days, or approximately 6 years worth of data. In my view that's a representative sample size, one large enough to draw conclusions from. Clearly, traders generally bid up shares into the start of earnings season and this is important information to have as a trader.
As I look ahead into earnings season, there is one group that I'm VERY interested in - Banks.
Even though the 10 year treasury yield ($TNX) has fallen the past few trading sessions, there's been an undeniable uptrend in the TNX since February 1st. Those higher yields have clearly had a positive impact on the banking industry ($DJUSBK) as can be seen from the chart below:
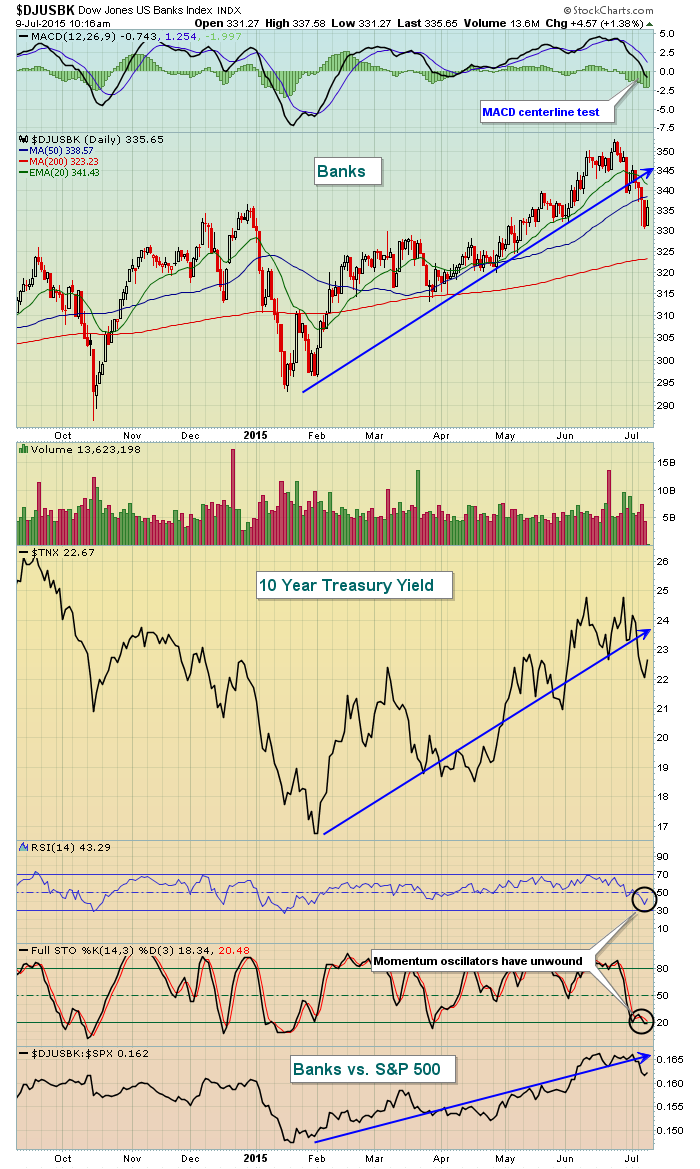
I believe banks will continue to benefit from higher yields in the second half of 2015. This is an interest rate bet for sure. I don't expect the 10 year treasury yield to soar, but a move to test resistance at 3.00% isn't out of the question. And such a move would be a boon to banks.
Recent selling has seen the banks' RSI drop back down to the 40 level, generally a nice entry point into an uptrending group. The blue arrows above show that banks, yields and the relative performance of banks are all trending higher. Therefore, let's see not only how banks report this quarter, but also what they have to say about the balance of 2015. I'm "banking" on bullish outlooks. In a prior article titled "Steepening Yield Curve Says Buy These Three Banks" I discussed the effect that rising yields have on bank bottom lines and suggested looking at three bank stocks in particular. Two of the three banks mentioned, OZRK and PNC, will report their quarterly results next week. Here are how these two stack up technically heading into their quarterly reports:
OZRK:
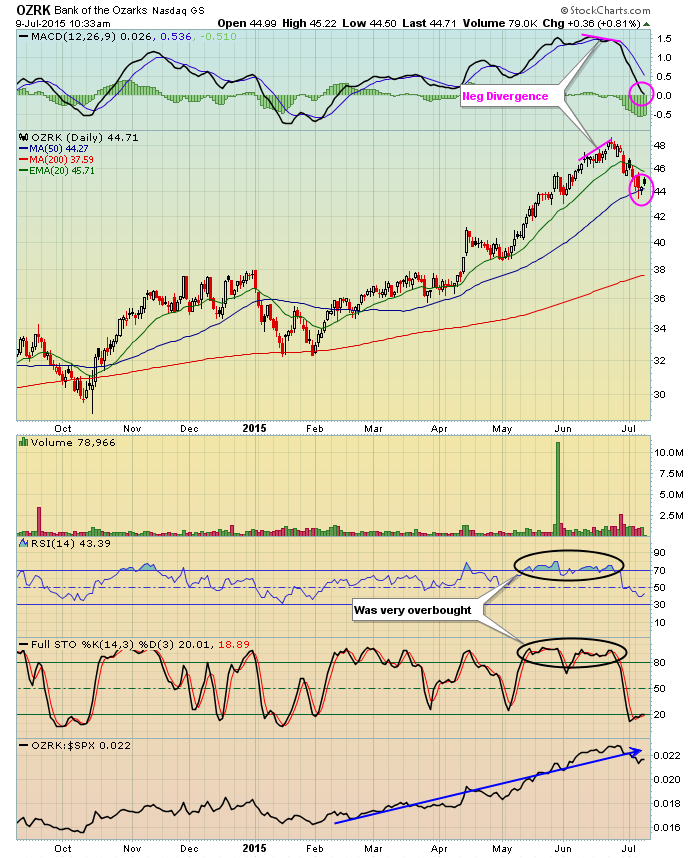
OZRK has been a great performer since the TNX began rising in February. But on its most recent higher, OZRK was extremely overbought and showed signs of slowing momentum in the form of a negative divergence. So the recent weakness was very timely as it unwound the overbought oscillators with the RSI dropping back to that key 40 level while the MACD resolved its issues with a centerline "reset". This one certainly appears poised to resume its advance as earnings await on Monday.
PNC:
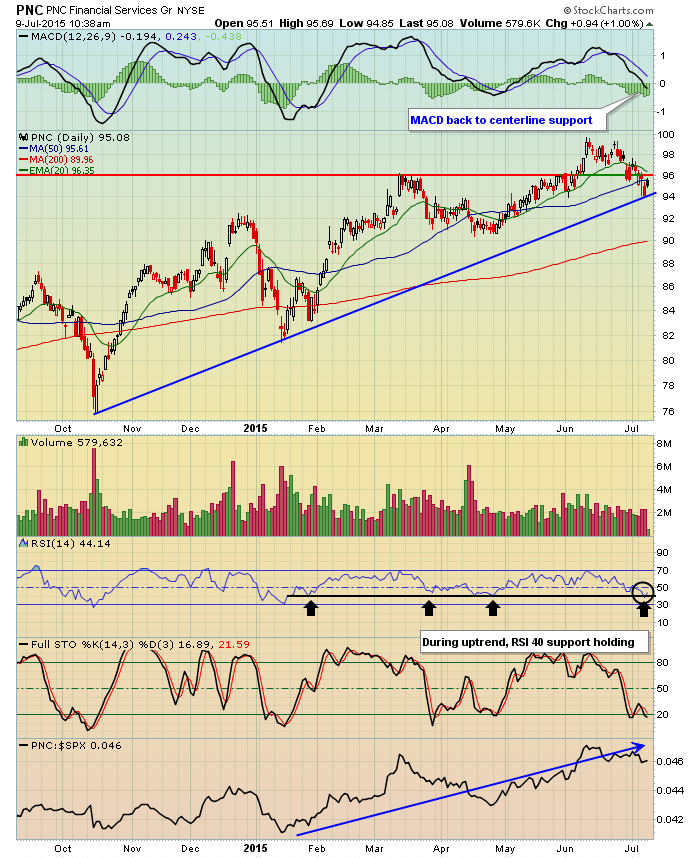
Recently, price support close to 96 failed to hold, but PNC has continued to hold onto trendline support as its RSI has dipped back to 40. You can see from the four black arrows that RSI 40 support has been strong for PNC throughout this uptrend and I'd look for continued support there until the market says otherwise. The relative strength of PNC vs. the S&P 500 has been clear since February as well.
Airlines will be another group to focus on. 2015 has been extremely tough, but some of that is profit taking while higher crude oil prices have taken a toll as well. But over the past few weeks, crude oil has once again begun to drop and that could aid airlines in their attempt to resume the climb they enjoyed throughout 2014. Key airline stocks will be reporting next week as well, including Delta Airlines (DAL) which is flashing a positive divergence on its daily chart.
If the stock market isn't interesting enough already with the increased volatility, it's about to become even more so with the plethora of earnings reports hitting Wall Street the next few weeks.
Happy trading!
Tom


