I've said many times before and I'll continue to repeat it - we must do our homework and then show the necessary patience and discipline to allow trades to set up for us. Part of doing homework is accumulating a number of stocks that are in bullish patterns (assuming you want to be long the market) and then simply waiting....waiting....waiting. It gets frustrating, but it pays off in the form of better reward to risk trades if you can enter just as stocks make their breakout or wait for a pullback to test the breakout level. This latter strategy is sometimes helpful to avoid entering during a false breakout where a stock reverses by the end of the day, failing to clear the price resistance level.
In this article, I want to provide six solid trade setups. Each of these companies have recently reported better than expected revenues and EPS so I'm already comfortable with basic fundamentals. Now it's just a matter of letting the technical picture provide me an entry. Here are six companies I'm watching closely:
j2 Global Communications (JCOM):
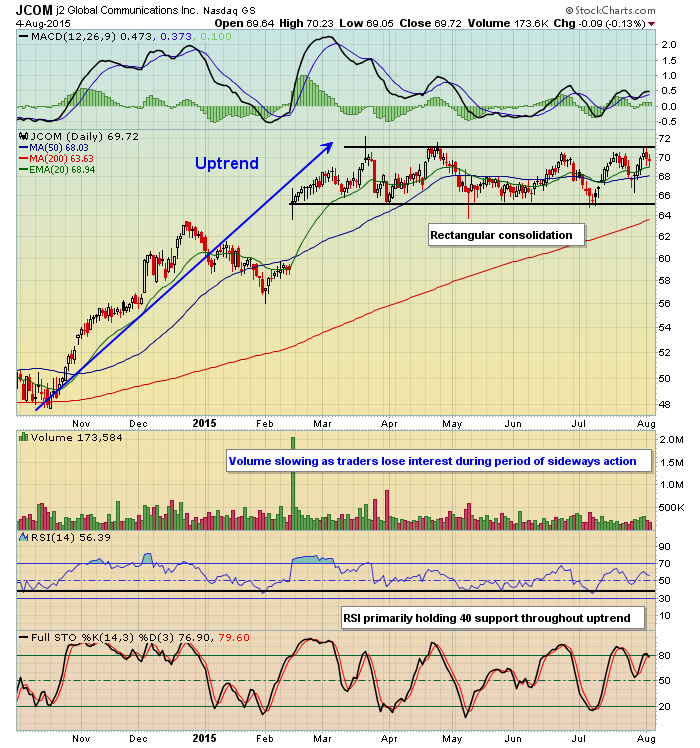
JCOM has been consolidating for several months with volume dwindling. But the sideways consolidation is more likely to break higher given the preceding uptrend. Volume accelerating as price resistance near 71.00 is cleared - that's the clue I'm looking for.
Salesforce.com (CRM):
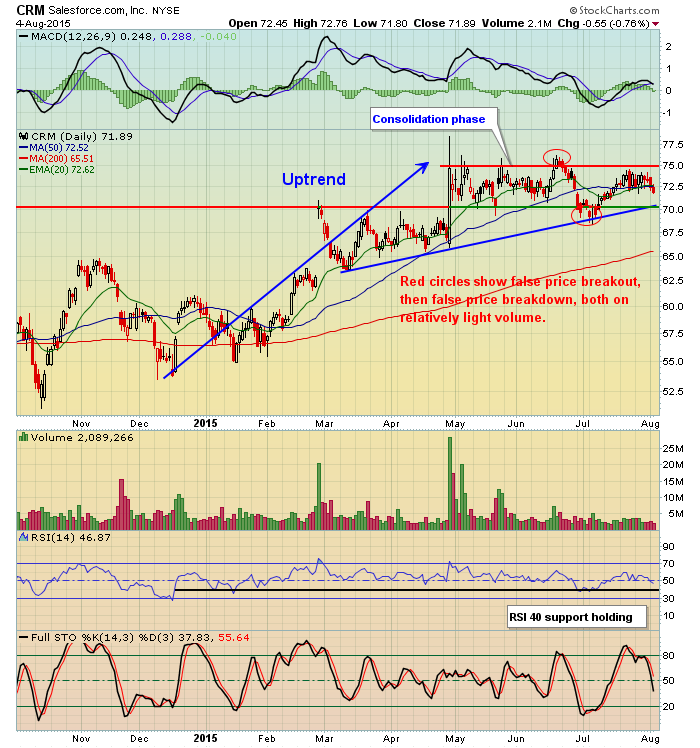
CRM is interesting because I can see a couple different bullish patterns. The sideways consolidation on lesser volume would be expected to breakout to the upside following a prior uptrend. Note the red circles that highlight both a false breakout above 75.00 (resistance) and a false breakdown below 70.00 (support). Most importantly, note the lack of volume to support either move. The pattern could also be interpreted as an ascending triangle with the blue uptrend line serving as the bottom ascending support line within the triangle. A breakout here could measure into the 83-85 area.
Intuit (INTU):
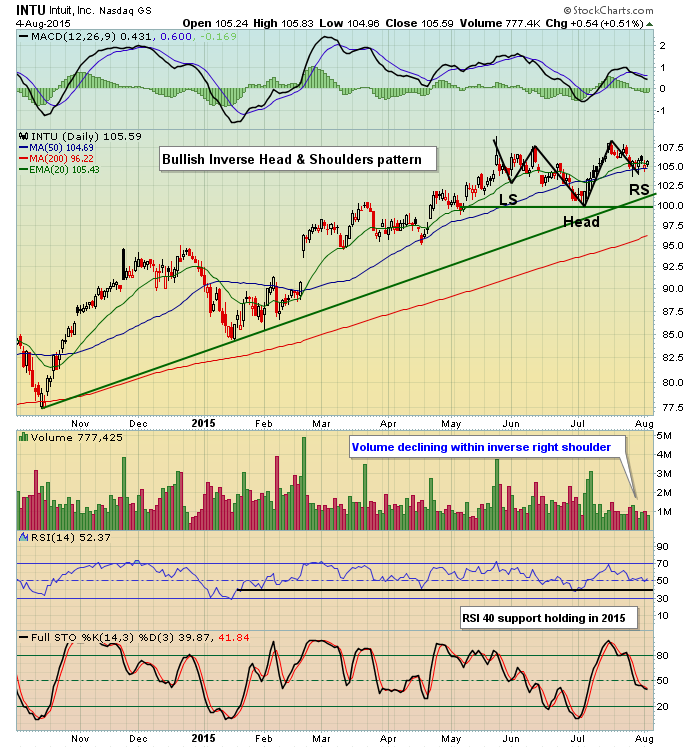
Generally, the best entry into a stock with a bullish inverse head & shoulders pattern is the inverse right shoulder. Why? Because if the pattern does resolve to the upside, the measurement ordinarily provides a nice reward to risk scenario. In the case of INTU, this pattern would measure to 116.00 if confirmed, while the inverse head would serve as support. That's where I'd want to keep my closing stop. Losing this level would also violate the green uptrend line. Entry at the current price provides roughly a 2 to 1 reward to risk and entering INTU any cheaper only increases the reward to risk ratio.
Isle of Capri Casinos (ISLE):
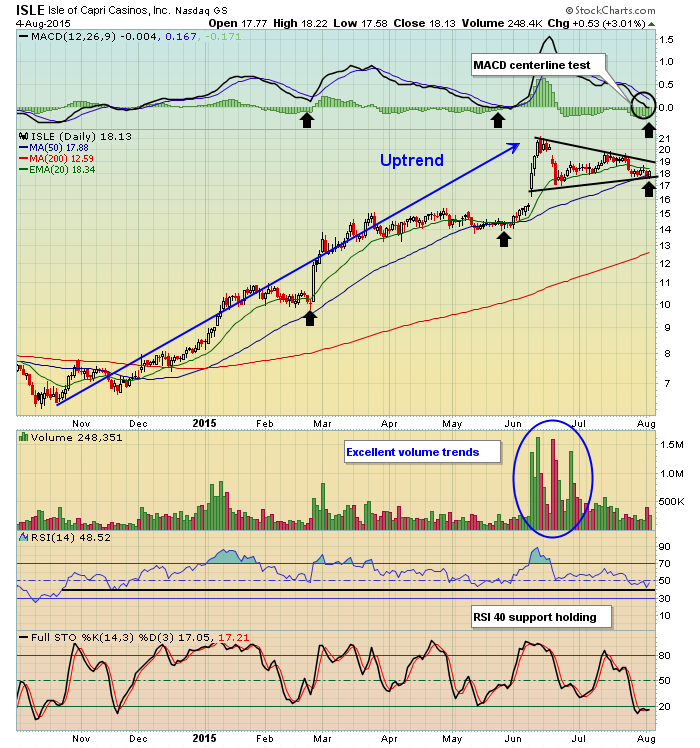
ISLE is consolidating in a bullish symmetrical triangle pattern after its recent uptrend. The selling over the past month or so has been on declining volume and it's also enabled the MACD to test centerline support while the 50 day SMA is tested as well. Note the black arrows that have previously marked the start of significant advances as the MACD hits or approaches centerline support while the 50 day SMA was tested. And ISLE is doing this while its peers have been struggling. Check out the Gambling Index ($DJUSCA) when you get a chance. It's been downtrending for months.
Rite Aid Corp (RAD):
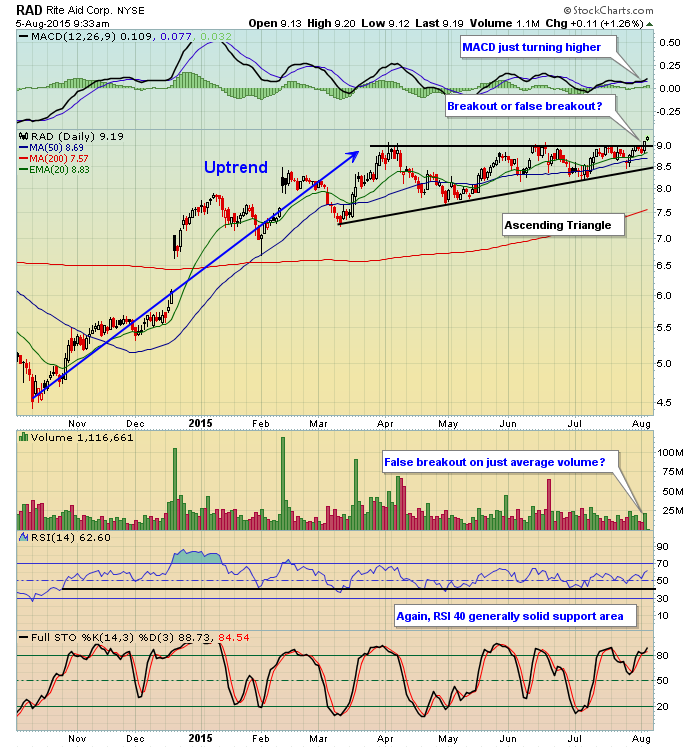
RAD is an interesting case study. At first glance, it appears as though the volume was not supporting the breakout of this bullish ascending triangle. But I want you to look at the intraday chart. Check this out:
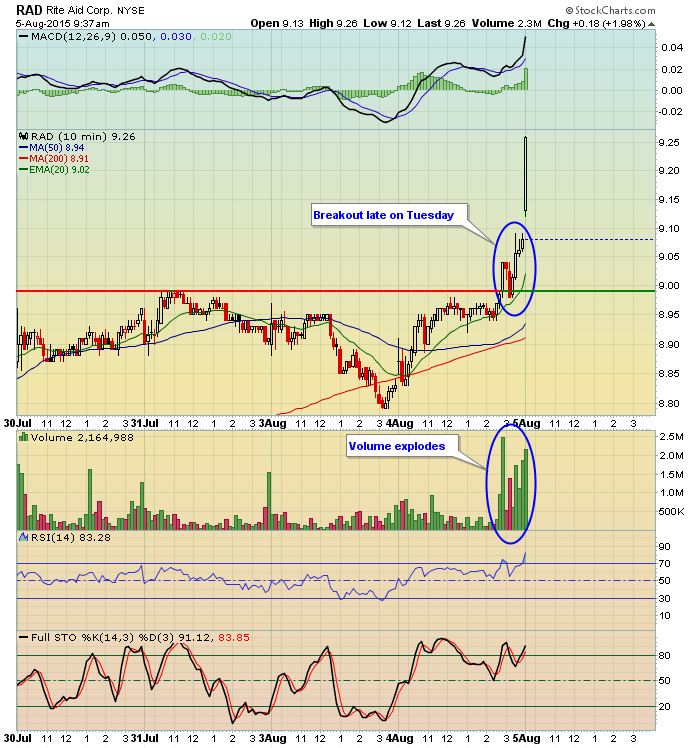
This provides a different picture of the volume as the breakout occurred. RAD would now seem to be very attractive on any pullback to test the 9.00 breakout level, or possibly its rising 20 day EMA.
Fortune Brands Home & Security (FBHS):
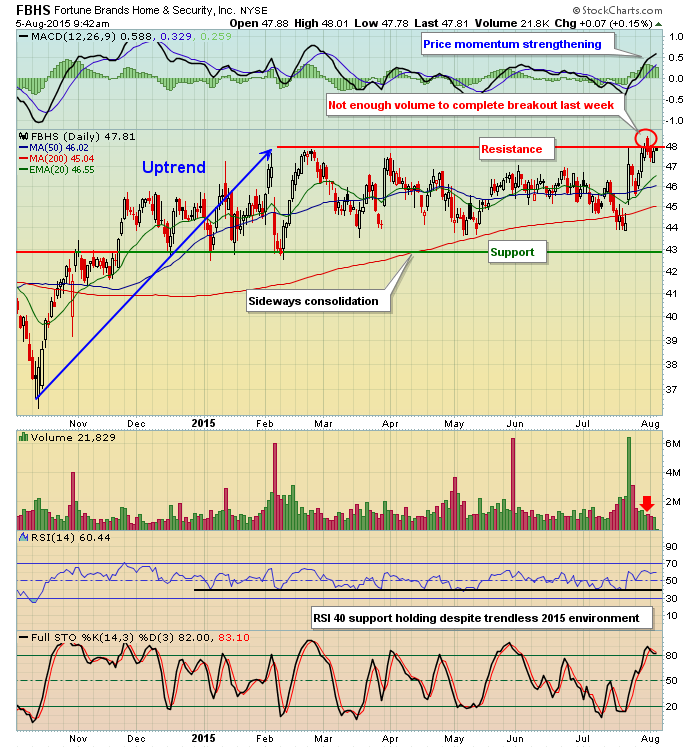
FBHS attempted a breakout last week by opening above 48.00 resistance. But the volume didn't confirm the move and ultimately it proved to be a false breakout and one to avoid. The consolidation here, however, remains bullish and I'm expecting to see a breakout in time. The real breakout should provide us very solid volume to confirm the action. We'll see.
I'll be reviewing these charts and others later today during my Trading Places LIVE webinar that starts at noon EST. It's FREE and you can register HERE. I've also been invited to join John Hopkins at EarningsBeats.com for a webinar on Thursday evening at 7:30pm EST to discuss the importance of doing your homework and finding companies that are solid both from a fundamental and technical perspective. This webinar is also FREE and you can pre-register by CLICKING HERE.
Have a great day and happy trading!
Tom


