Risk management is paramount to a successful trader. It sounds easy enough, but what does it mean? Well, it can mean lots of different things to different people. The easiest way to manage risk is to remain in cash. You can sleep without worrying what happened in China overnight. But there's an opportunity cost that you'd have to consider there. When the stock market moves higher, your cash loses purchasing power. Another way to manage risk is to trade ETFs (Exchange Traded Funds), which invest in a basket of stocks. That helps to manage individual stock risk. Those of us who trade individual stocks know all too well that feeling when a sector moves higher and the stock you own within that sector doesn't. You also can manage risk by the number of shares you trade. Managing risk also includes diversification into other asset classes like bonds, real estate, etc.
As a short-term to intermediate-term trader (holding stocks anywhere from one day to a few months), managing risk is simply buying the stock I want to own at the best possible price - within reason - and then keeping a reasonably close stop level in place in the event the stock doesn't perform the way I believed it would. Without a doubt, I have one absolute favorite trading strategy on when to enter a stock and it should be no big surprise.
Major Price Support
When I talk about MAJOR price support, I'm not referring to the intraday low from yesterday on 1,000 shares. I'm referring to a significant resistance level that was cleared on heavy volume after weeks or months of basing. That prior price resistance then becomes price support on future selling. Identifying these stocks BEFORE they breakout is your planning phase. These types of stocks generally offer up excellent reward to risk ratios because they're just beginning a major move higher and the breakout level (or slightly below) represents an area of support the stock should hold on any selling. So you can keep a tight stop. That's the beauty of StockCharts.com. Without the tools available here, I would most definitely forget the importance of big levels on individual stocks. I look at hundreds of charts every day and if I don't store them for future review, they simply get lost and go away. As a trader, you cannot allow great setups to "go away". So I created a "ChartList" to track stocks that I watch so I won't forget. You can then annotate those charts to provide you key reminders about things like "stop" levels, target prices, etc. Here's how you create a ChartList. I blogged about Interface, Inc. (TILE) a few months ago in the DITC blog. The article was titled, "Interface (TILE) Floors It, Approaches Major Resistance". Along with Arthur Hill and Greg Schnell, great ideas are presented on a regular basis on the DITC blog so be sure to subscribe to that blog if you haven't already. Take a look at the long-term chart, the breakout, the retest of that breakout and the performance on TILE since it was featured:
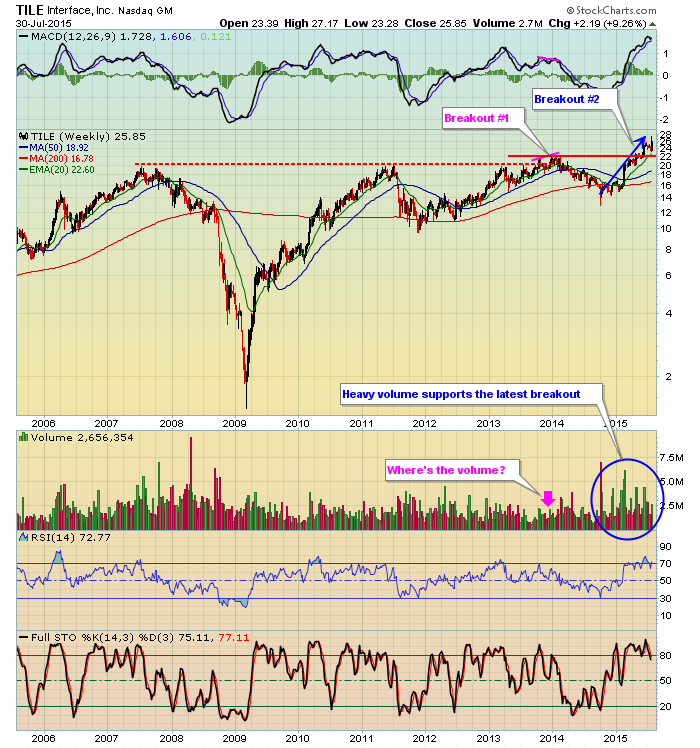
The pink dotted line, "call out" box, and arrow all show a breakout on weak technicals in late 2013. There's a negative divergence and volume really wasn't supporting a multi-year breakout. That's NOT what we want to see. But check out the second breakout. That occurred on massive volume with a weekly MACD that was pointing straight higher, a sign of strengthening bullish momentum. That breakout occurred at roughly 22.00 and TILE has moved another 17% higher in just the past few months. Without saving this chart in a ChartList, I may have missed the breakout.
Here are two other charts with similar setups on daily charts worth watching/trading:
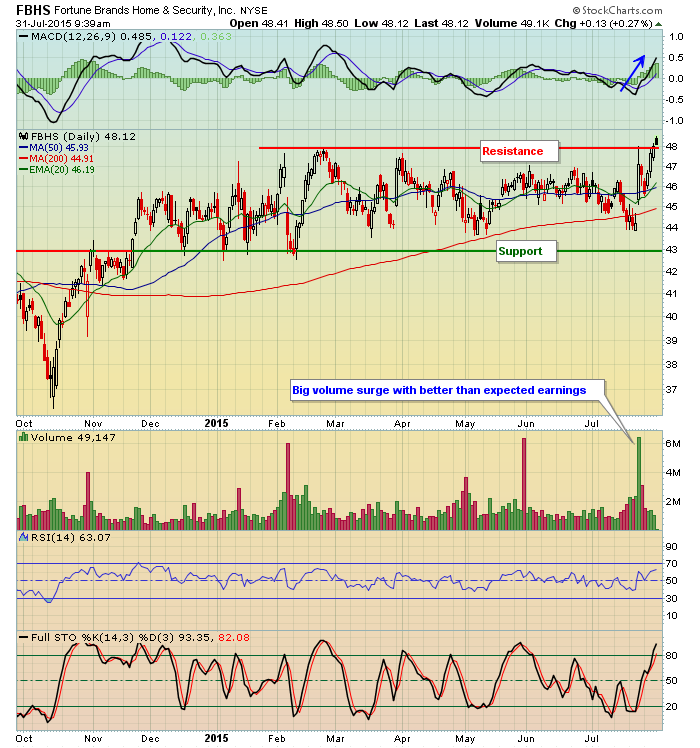
Fortune Brands Home & Security, Inc. (FBHS):
Restoration Hardware (RH):
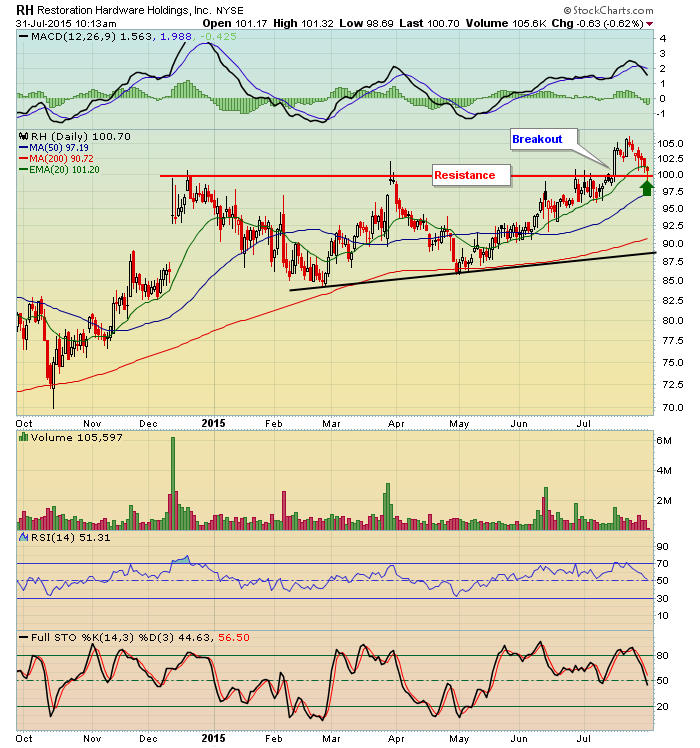
First, keep in mind both of these charts are daily charts, not like the long-term weekly resistance shown on the TILE chart. The longer the time frame, the bigger the resistance level becomes. But both of these companies, FBHS and RH, look like tradable candidates given their setups and breakouts or potential breakouts on their daily charts. On the first chart, FBHS opened above price resistance at today's open, but the volume thus far is uninspiring. A surge in volume later to accompany a breakout would be bullish. Otherwise, this looks like a failed attempt. RH recently broke out above 100.00 on solid volume and is now retesting that breakout level on lesser volume. I would look for price support near 100.00 to hold. The rising 20 day EMA is also being tested at the current price so it will be interesting to see if buyers re-emerge at this area on the chart.
I will review these charts and others in today's "Trading Places LIVE" webinar. You can join me by CLICKING HERE to register - it's FREE! And please be sure to subscribe to my blog at the upper right hand side of this article.
Have a great weekend and happy trading!
Tom


