I have been ignoring much of the energy sector for months as their technical indications suggested weakness would continue. The energy ETF (XLE) is down over 13% in just the past six months and with crude oil unable to gain a bid, it's difficult to spend too much time trying to catch the proverbial bottom in this group. But a couple of things are beginning to line up bullishly for the group. First, crude oil prices ($WTIC) are approaching the lows of 2008 and 2009 and when crude oil bottoms, generally so does the XLE. Check out this relationship:
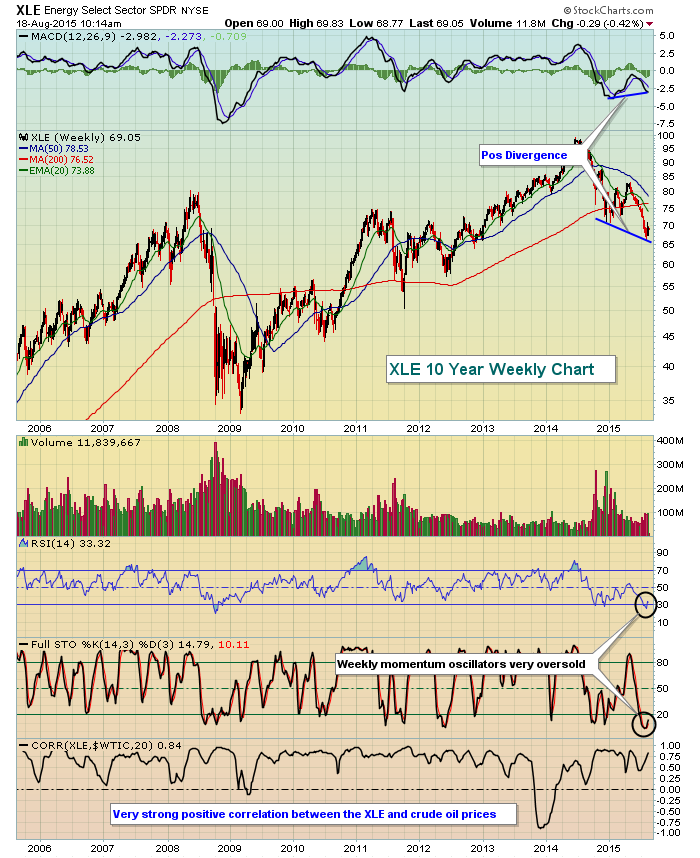
By just about any measure, this space of the market has been beaten up rather badly. The weekly momentum oscillators were both extremely oversold just prior to the recent short-term bounce. On the most recent price low, the weekly MACD was much higher, suggesting selling momentum could be waning. Note also that there's a very tight positive correlation between the XLE and crude oil prices. It's noteworthy that crude oil has nearly returned to the upper $30s per barrel which would test the lows from 2008 and 2009. Just a normal bounce in crude oil should positively affect energy stocks.
In addition to positives developing on the weekly chart, there are also some shorter-term positives on the daily chart as well. Take a look:
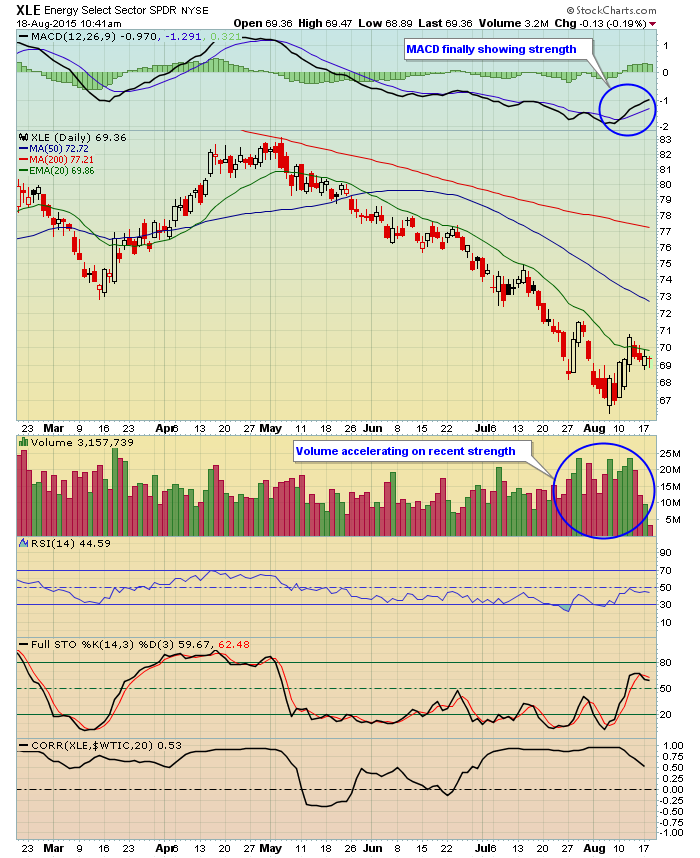
The good news here is that the daily MACD is finally reacting to price strength and turning higher. On any new price low, we'll likely see a positive divergence print on the daily chart to match the one above on the weekly chart. Note that the correlation between the XLE and crude oil prices is also quite positive on the shorter daily charts as well. Therefore, given the fact that crude oil prices are nearing major support, there's a very good chance that energy shares could very well be in a bottoming phase. If that's the case, this is a sector that could be preparing for a more substantial rebound, aiding the S&P 500 as it continues to attempt to stave off the bears and sustain the six year bull market.
The top three holdings of the XLE are Exxon Mobil (XOM), Chevron (CVX) and Schlumberger (SLB). These three stocks account for approximately 37% of the XLE performance. Obviously, they'll have a lot to do with where the XLE goes from here. In looking at the charts, SLB looks fairly solid with XOM outperforming its peers in 2015 despite a price downtrend that remains in place. CVX appears to be the weakest as there are few signs of slowing downside momentum and CVX continues to downtrend vs. its peers. Let's take a quick glance at XOM and SLB:
XOM:
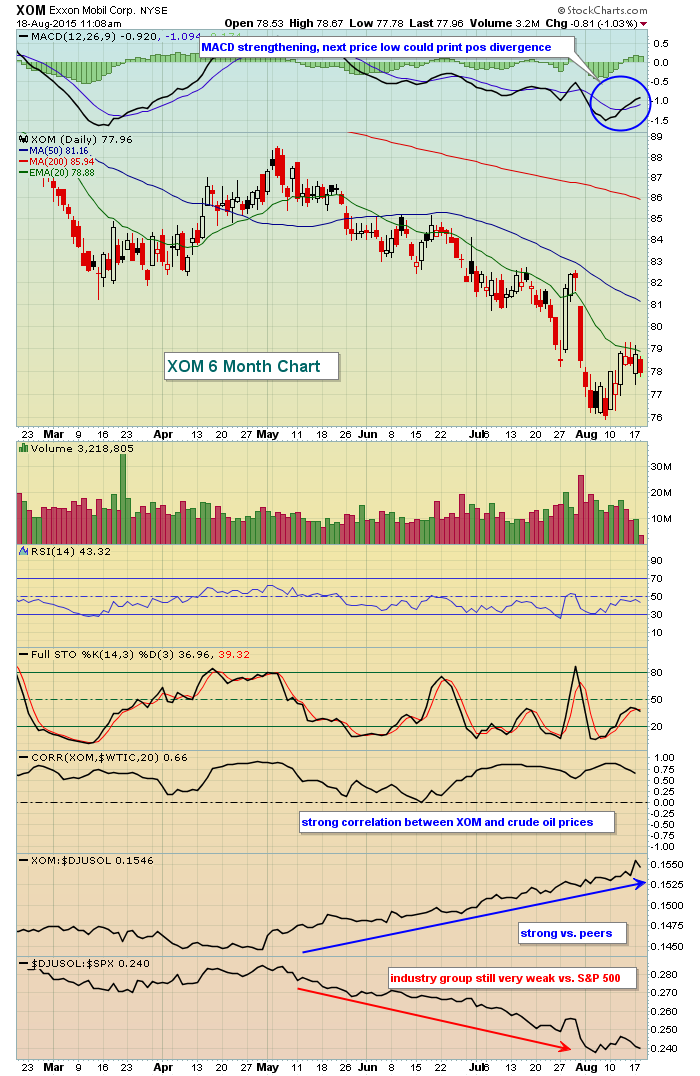
Volume has increased recently to coincide with higher prices and the XOM's relative strength vs. its peers since May is obvious. This stock needs a catalyst to spur its industry group and sector and that could definitely come in the form of a double bottom in crude oil along with positive divergence emerging technically.
SLB:
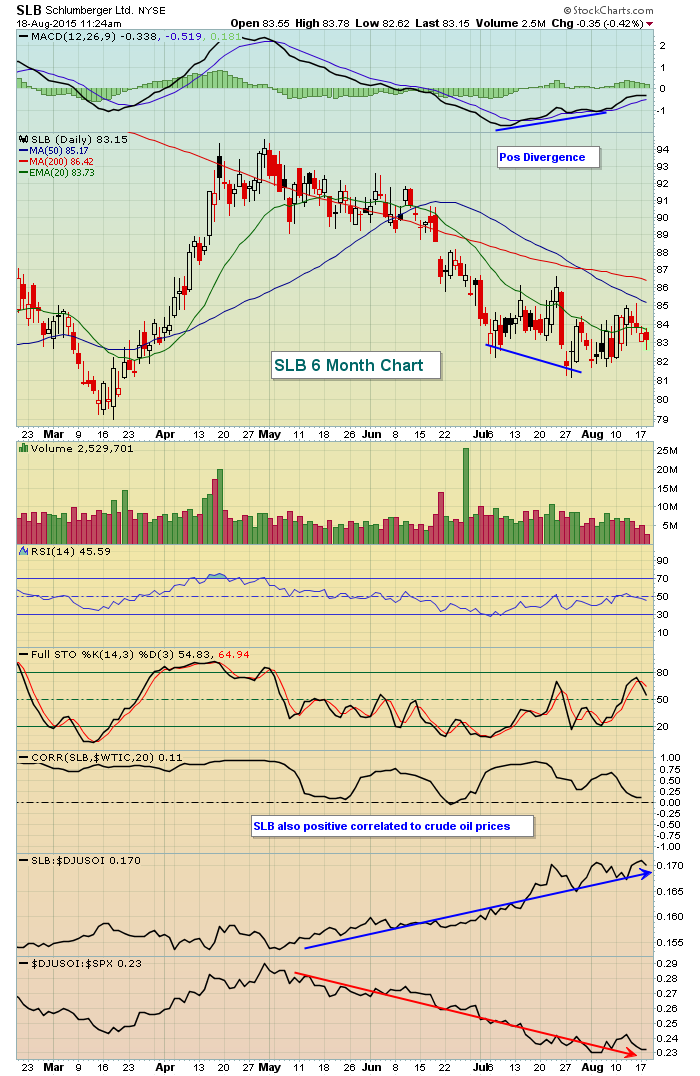
Like XOM, SLB also is performing very well against its own industry group despite a group that is very weak relative to the S&P 500. Should its group actually begin outperforming, SLB appears poised to lead given the positive divergence that's already printed on its daily chart. Volume trends also appear to be turning more bullish.
While it may still be too early to call a bottom, it does appear that energy could be moving closer and closer to again moving in lockstep higher with other sectors and that could ultimately be the missing piece of the puzzle to forge a breakout on the S&P 500. September is normally a rough month for energy shares as it is for much of the stock market so we'll likely need more patience, but signs are at least beginning to build that a bottom is at hand or rapidly approaching.
Happy trading!
Tom


