Market Recap for Wednesday, September 9, 2015
Technical failure after technical failure. Bearish engulfing candles. Dark cloud cover candles. Opens above 20 day EMAs and closes beneath. You name the short-term failure and it probably occurred on a chart somewhere on Wednesday. After two weeks of torment, global markets rallied to provide the bulls here in the U.S. an opportunity to turn the tide longer-term. Instead, they were swept away by waves of bears on Wednesday. Take a look at the NASDAQ:
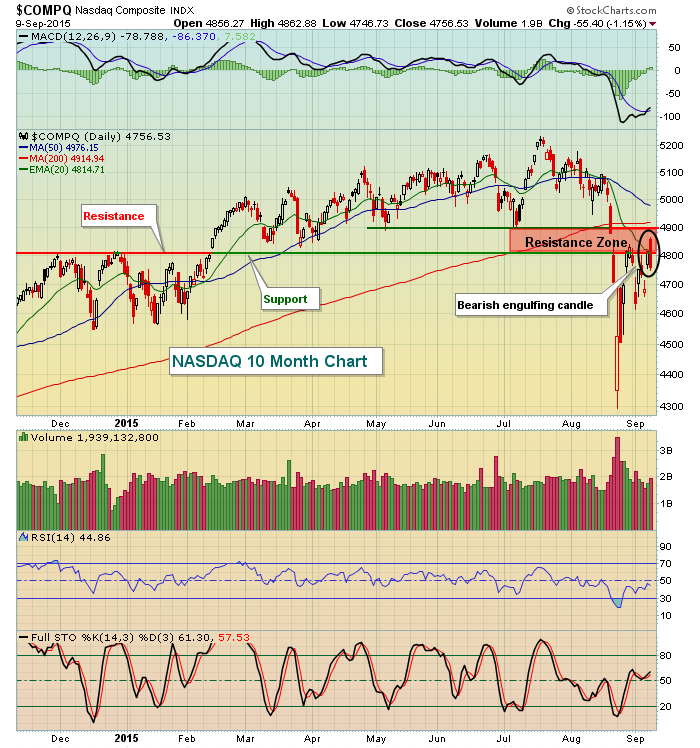
The bearish engulfing candle that accompanied a false breakout above the 20 day EMA is exactly what I feared most. The increasing volume and volatility poses problems ahead as well. The Volatility index ($VIX) had been downtrending and bulls were pinning their continuing recovery hopes on the VIX falling further. That wasn't the case, however, as the VIX spiked at key gap support, putting pressure on equities. Take a look at the bounce in volatility:
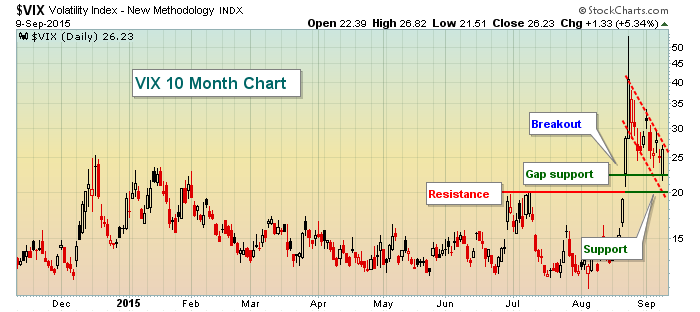
For the bears, volatility bounced exactly where it needed to - as it neared price and gap support. That coincided with gap and price resistance on our major indices and equity prices downtrended as a result all day on Wednesday after the opening gap higher.
Japan's Nikkei index surged higher overnight on Tuesday and strength there and in other Asian markets had global markets poised for a strong open on Wednesday. By the time the U.S. market closed, all nine sectors finished lower, although much of the relative weakness was found in defensive groups and that could be a good sign for later down the road. Near-term, however, the U.S. market is broken and in need of technical repair.
Pre-Market Action
If the futures action last night and this morning are any indication, then buckle your seat belts right now. Last night, it appeared as though we'd be looking at a very weak open to confirm the bearish engulfing candlestick that printed on our major indices. By early this morning, U.S. futures were pointing to more than a 1% rise to thoroughly confuse bulls and bears alike. And over the past couple hours, futures have once again turned negative.
Lululemon (LULU) reported results that met or exceeded consensus estimates. However, the company lowered earnings guidance for next quarter and the stock market is not in a forgiving mood currently. LULU is down close to 10% in pre-market trading. Krispy Kreme (KKD) did not serve up a treat for investors either. They missed estimates and guided future numbers lower and are down more than 16% in pre-market trading. Ugly.
For treasury yields, the 10 year continues its battle at 2.20%-2.25%. Equity bulls would like to see a selloff in treasuries with the 10 year yield rising to break out of this congestion. The selling of treasuries would potentially help to fuel a stock market rally. Without this breakout, the road will only be tougher.
With little economic news to trade off of this week, traders are staring at technical conditions and those conditions deteriorated with Wednesday's reversal. Given the high volatility, ANYTHING goes so please be careful. Despite the reversal, bulls can continue to point to the fact that weakness has not been concentrated in aggressive names. This suggests more of a correction than a bear market and that's giving the bulls something to cling on as we open for trading today.
Current Outlook
Much of our recent direction lately has been a carryover from global markets that open before the U.S. market. The market I watch closest is the German DAX and for one simple reason. It is the most positively correlated foreign index to the S&P 500. We saw a bit of an advanced warning as the DAX topped back in April - before the S&P 500. The DAX printed a reversing candle of its own at its Wednesday close as it too failed to clear both price resistance and 20 day EMA resistance. Have a look:
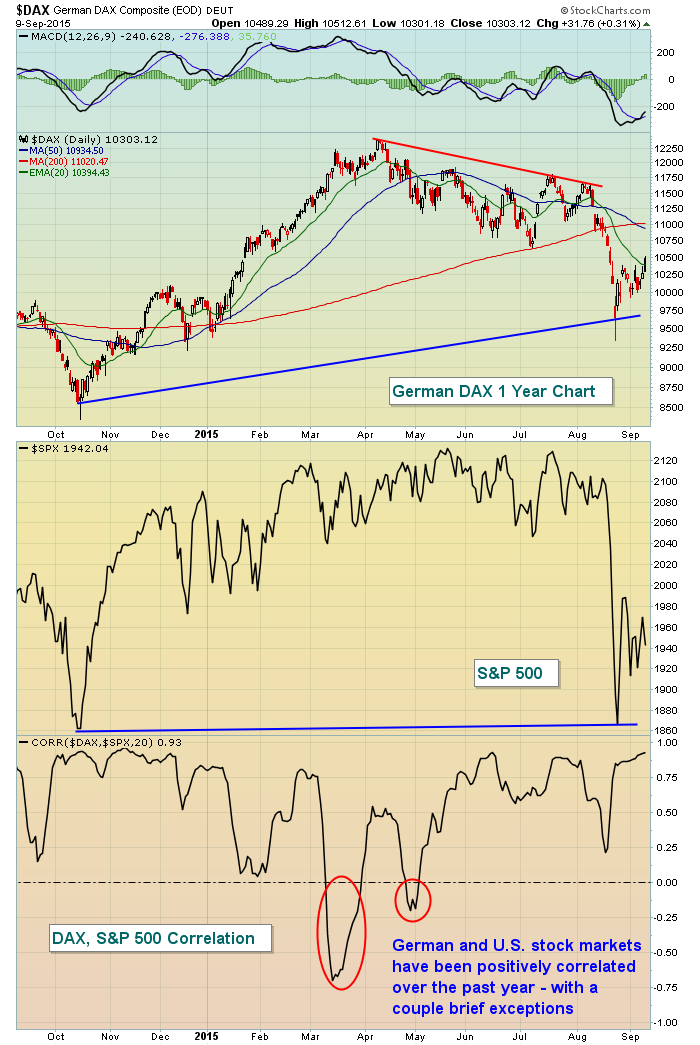
The bottom indicator window shows the German - U.S. stock market "correlation". Readings at +1.0 mean that two indices are positively correlated (moving in same direction) while readings at -1.0 suggest the opposite - that they're negatively correlated and tend to move opposite one another. The positive correlation shown above represents the past year, but long-term charts show a tight positive correlation between these two markets. If you're looking for foreign market behavior to help predict the direction of U.S. stock prices, I'd suggest you keep a very close eye on the happenings in Germany. Another selloff there and fresh new lows would almost certainly print a positive divergence with respect to its daily MACD. That could mark a very important bottom just as seasonality issues here in the U.S. abate. Over the past 20 years, the DAX also tends to follow similar historical patterns as the U.S. with its best three consecutive months being October through December.
At last check, the DAX was down this morning, confirming the bearish reversing candle from Wednesday. This won't help the U.S. market if the DAX remains in negative territory.
Sector/Industry Watch
Broadline retailers ($DJUSRB) were attempting to make a significant breakout on Wednesday, then failed as trendline, price and moving average resistance all converged and eventually wore down the bulls. The problem is that many industry groups are exhibiting these same signs of failures. Take a look at the DJUSRB chart to see what the bulls in this space will be looking at near-term:
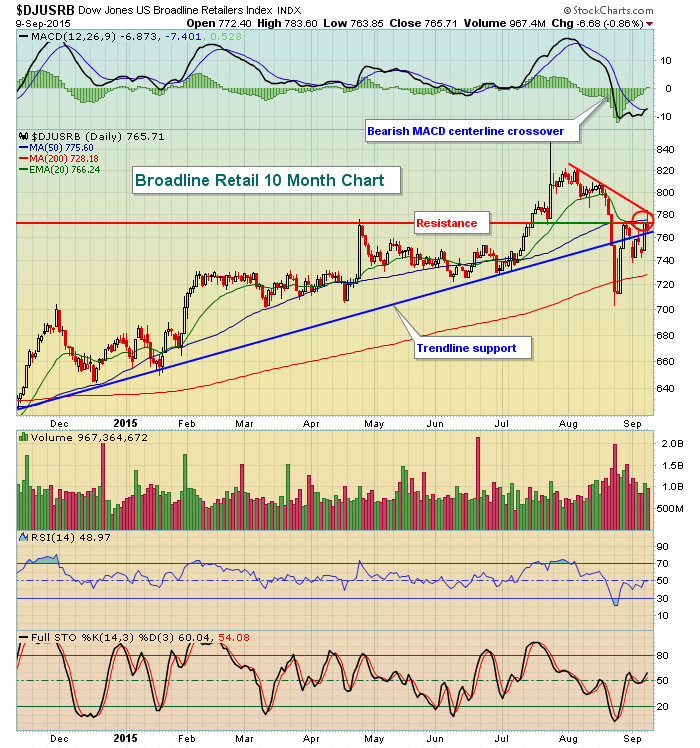
The red circle represents resistance from the downtrend line from the early August high, price resistance and both the 20 day EMA and 50 day SMA resistance as well. The daily MACD shows a recent bearish crossover and volume accelerated on the recent trendline breakdown. Wednesday's high was attempting to clear all of this resistance, but instead left a lingering tail to the upside with a very poor finish. These types of reversals at resistance generally result in further short-term weakness so the bulls cannot be feeling too optimistic after their missed opportunities yesterday.
Historical Tendencies
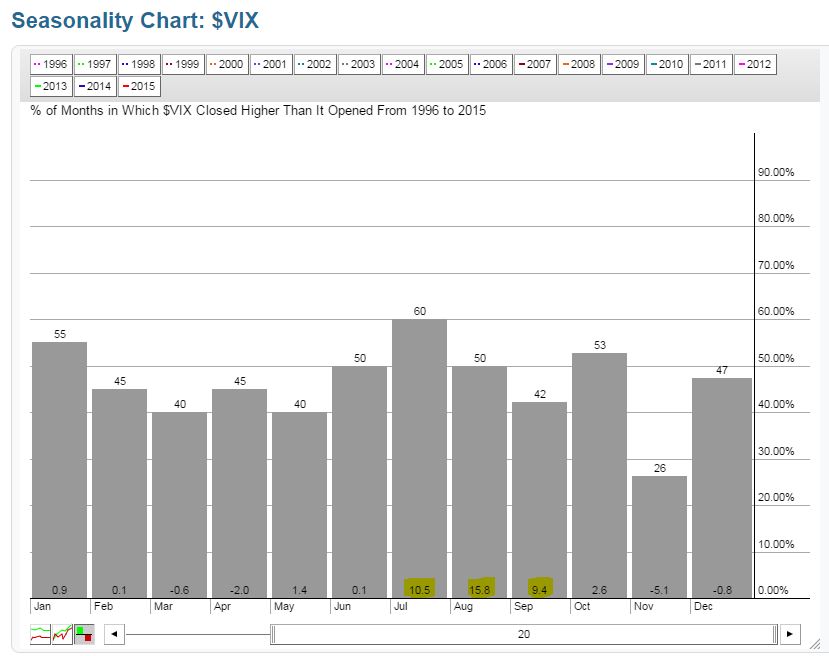
One tendency that's certainly living up to expectations is the increased level of volatility normally seen during the summer months. In August, the VIX moved from 12.12 (July close) to 28.43 by month's end. Despite a few attempts at an equity rally in September, the VIX remains elevated, closing at 26.23 Wednesday after rising more than 5% on the session. That may not seem like a big move, but keep in mind that equities gapped higher Wednesday with the VIX tumbling more than 11% at the open. So there was quite the reversal in expected volatility by session's end. Here's a quick reminder of how the VIX tends to rise during the bearish summer months. Check out the yellow highlighted "average monthly increases" over the past 20 years:
Key Earnings Reports
Lululemon (LULU): $.34 (actual) vs. $.34 (estimate)
Key Economic Reports
Initial jobless claims released at 8:30am EST: 275,000 (actual) vs. 275,000 (estimate)
July Wholesale Trade to be released at 10:00am EST: +0.3% (estimate)
Happy trading!
Tom


