Market Recap for Tuesday, September 8, 2015
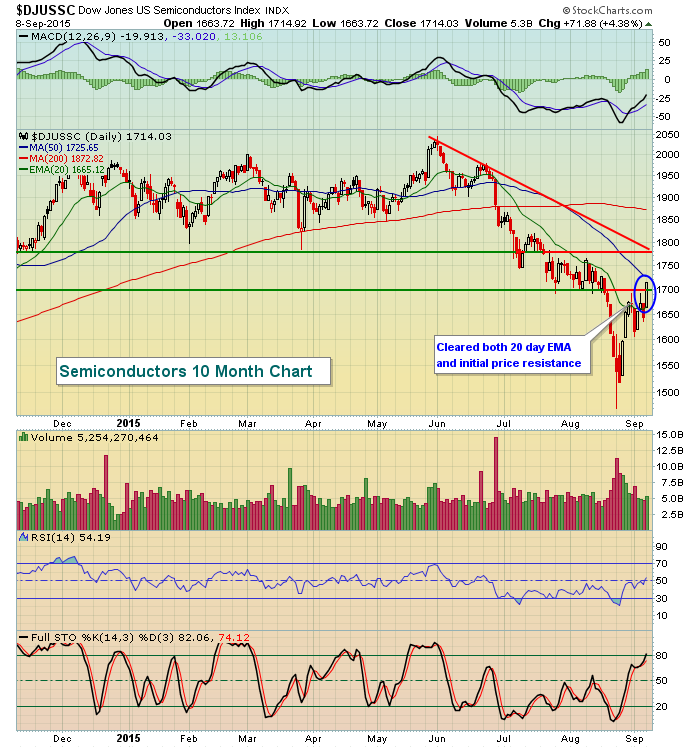
As we've seen often of late, the U.S. equity markets surged at the open but failed to add to those opening gains until the final 90 minutes of trading. At that point, buying resumed and all of our major indices finished on their highs. Given the steep drop in equities last week, the bulls were determined to carry overnight strength from global markets into our opening bell. While technically the opening gap did little to challenge key resistance levels, the end of day strength did move many areas of the market up to significant resistance. Consumer discretionary (XLY), technology (XLK) and industrials (XLI) finished just one penny, six pennies and nine pennies, respectively, beneath their 20 day EMAs. The other six sectors have a bit more work to do to approach that key short-term moving average. Semiconductors ($DJUSSC) had been a major laggard within the technology space as it remains one of a handful of industry groups within technology that is down more than 10% over the last three months. The group is up more than 6% over the past week, however, and cleared both its 20 day EMA and price resistance on Tuesday. Check it out:
Pre-Market Action
Japan's Nikkei index soared 7.7% overnight, leading Asian markets to huge gains. That momentum, coupled with hopes of China stimulus, has equity markets worldwide higher this morning. Based on where futures now stand, it appears all of the major indices in the U.S. will open above their respective 20 day EMAs, setting up another critical test of resistance. In addition to its 20 day EMA, the reaction high on the S&P 500 was 1993 on an intraday basis and 1989 on a close. Unless we see a major reversal sometime before 9:30am EST, the S&P 500 will likely challenge or exceed these levels at the opening bell. Then the question becomes, "how will we close?" A challenge of resistance with another bout of heavy selling could leave us with a bearish candlestick (engulfing, dark cloud cover, etc) at major resistance. And everyone should realize by now the bearish historical tendencies during the month of September. Thus, the bulls may come under attack. Will money on the sidelines be lured in on a technical basis?
Bellwether technology stocks like Apple (AAPL) and Facebook (FB) will be tested at the opening bell as well. Both closed on Tuesday just beneath their respective 20 day EMAs and are trading in pre-market above that moving average. Will the gains hold? Will they be built upon? Or will the bears turn the tide during the day's trading? It's going to be interesting for sure.
Current Outlook
Gains on Tuesday have put the bulls within reach of a significant technical breakthrough - clearing those 20 day EMAs. While closing above these moving averages doesn't guarantee us that everything will be fine and that the bull market is resuming, it sure as heck beats the alternative. It's encouraging to see our aggressive sectors leading the charge since last Tuesday's close. The financial sector is the only aggressive sector that's lagged during this rally. Technology, industrials and consumer discretionary are leading the charge. Trucking, airlines and railroads are three of the top four industry groups within the industrials sector. Those groups had been beaten down rather badly of late. Of course, I like to keep a close eye on the relationship between transports ($TRAN) and utilities ($UTIL). I posted recently that this ratio continued to support a bull market and the renewed strength in these stocks is definitely something to continue watching. Here's a refresher on the ratio I follow:
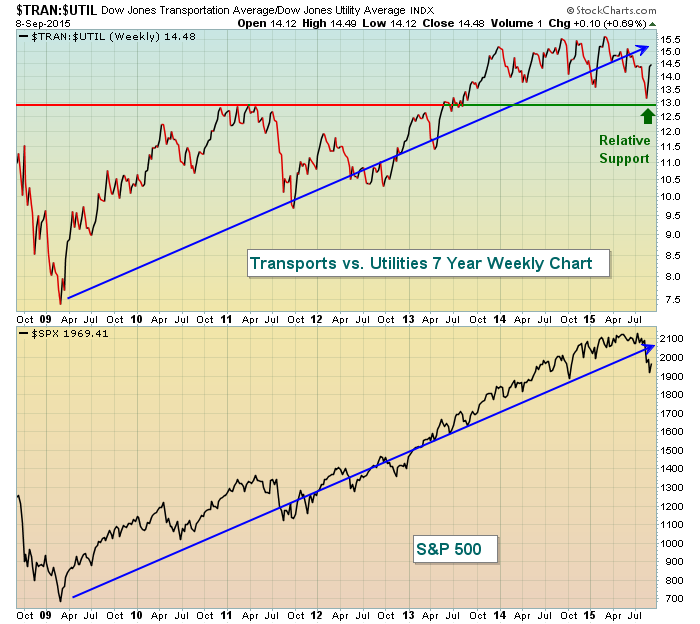
The general trend in both the S&P 500 AND the relative ratio of the TRAN:UTIL is higher and relative support on the latter was held near the 13 level. A breakdown beneath 13 on this ratio would add a bit of confirmation to the price weakness we had seen in the S&P 500 of late. But thus far, the S&P 500 has held October 2014 price support and the relative support of the TRAN:UTIL has held as well. In my view, this is a good sign for the bulls - in time.
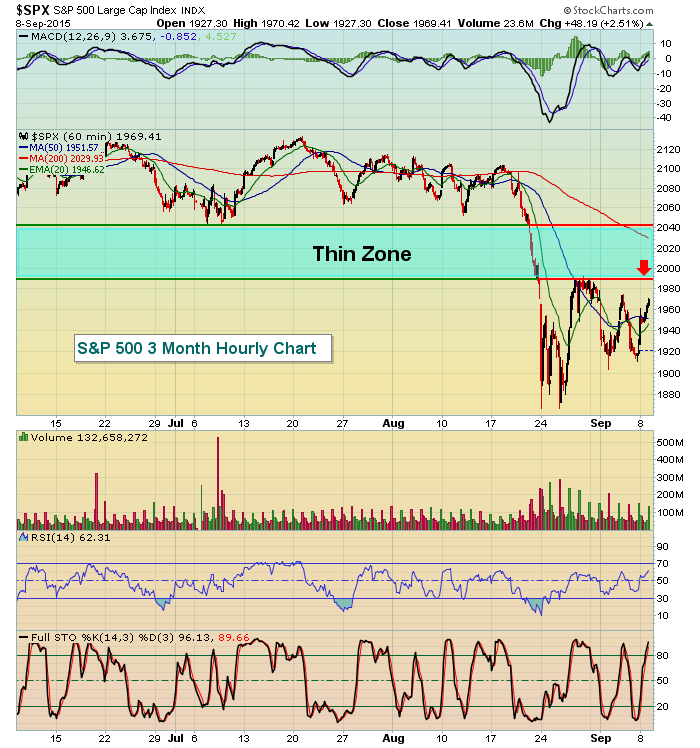
In the short-term, the S&P 500 shows price resistance just above 1990. If this price resistance level can be taken out, however, there's a "thin zone" where the bulls are likely to encounter little resistance in the form of price. As you can see from the chart below, the drop from 2040 to 1990 was quick and steep with little support along the way. That suggests we could see a quick recovery to that 2040 area if the 20 day EMA is negotiated along with 1990 price resistance. Take a look:
If you're bullish, the one thing you do NOT want to see is a gap higher today and a failure with closes across the board beneath those 20 day EMAs. Such failure would likely lead to the resumption of the downtrend. For now, I'd view the recent selling as a short-term downtrend within the confines of a continuing bull market.
Sector/Industry Watch
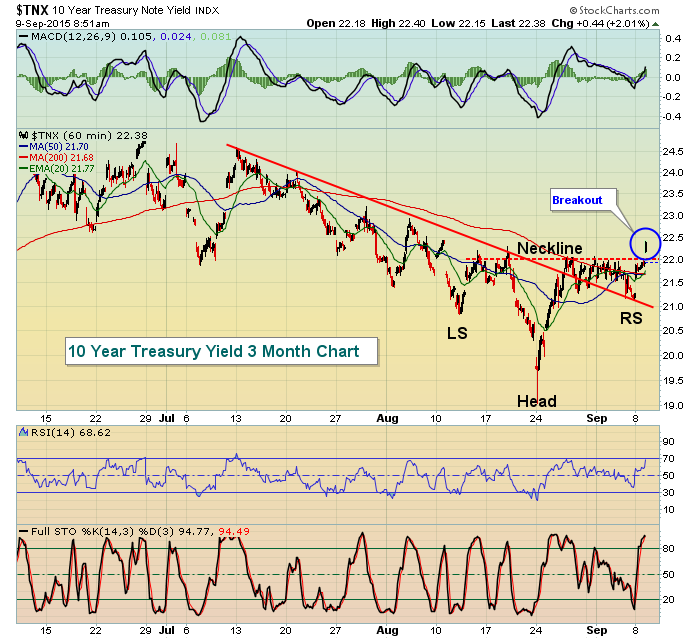
Not noted yet was the weak performance in treasuries on Tuesday. Treasury prices fell with the 10 year treasury yield ($TNX) climbing 6 basis points back near 2.20% resistance. If pre-market is any indication on what will transpire during today's session, equity bulls are liking what they're seeing as the TNX cleared the 2.20% resistance hurdle in early action, representing a bottoming reverse head & shoulders breakout. The selling of treasuries and short-term breakdown creates proceeds which can then be used to fuel an equity rally. That's what many traders will be watching today. Check out the TNX chart so far this morning:
Homebuilders ($DJUSHB) will be very interesting to watch today. Higher treasury yields might suggest homebuilders will struggle, but that's not what the charts are telling us. In fact, the DJUSHB broke back above the 600 level with force on Tuesday and this group remains the BEST performing industry group over the last three months, rising nearly 14% during a time in which most industry groups have lost ground. Here's a look at home construction:
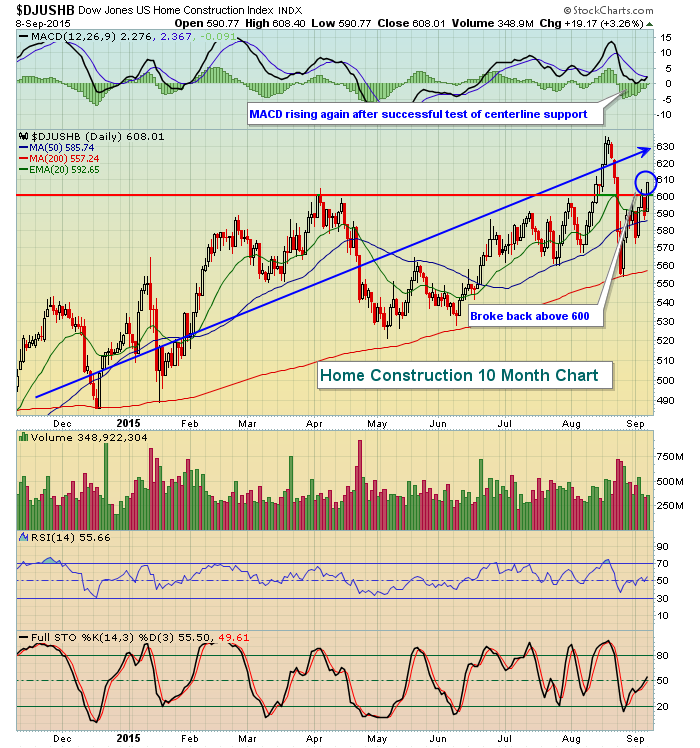
While we need to watch for potential reversals given the high volatility and seasonality, the odds still remain that this recent weakness is nothing more than a short-term correction within an extended bull market. Action like what we're seeing in home construction, transportation and consumer stocks definitely support this theory.
Historical Tendencies
It's been a wild ride thus far in September with gap ups and gap downs scattered everywhere. But on the S&P 500 we ended August at 1972 and we closed on Tuesday at 1969. Today's opening strength will provide the S&P 500 with month-to-date gains, quite an accomplishment given that we opened the month with a 59 point (3%) loss. There's one thing to remember about September. Despite not performing very well, the first half of the month is generally better than the second half. So while the bears may feel like they're losing the current battle, history is on their side to see further weakness later in September and to win the war.
Key Earnings Reports
None
Key Economic Reports
None
Happy trading!
Tom


