Market Recap for Monday, August 31, 2015
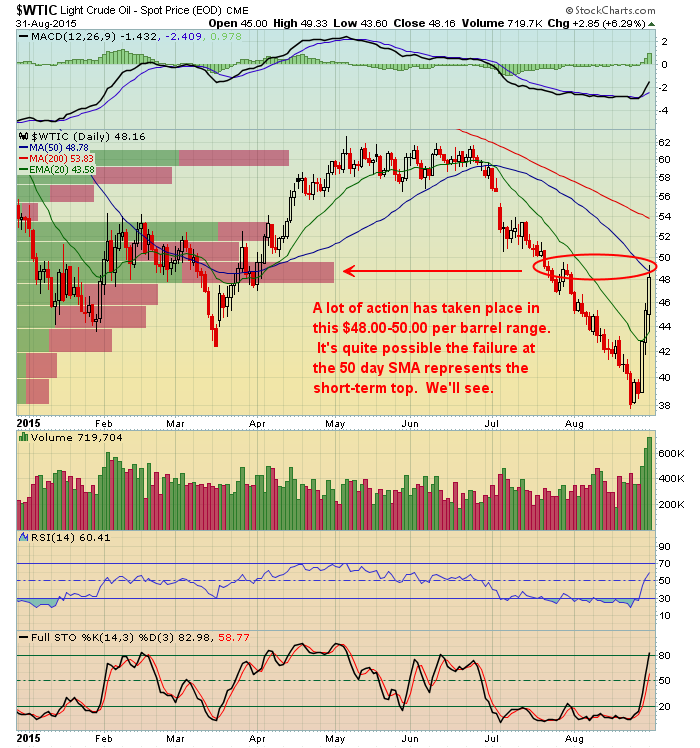
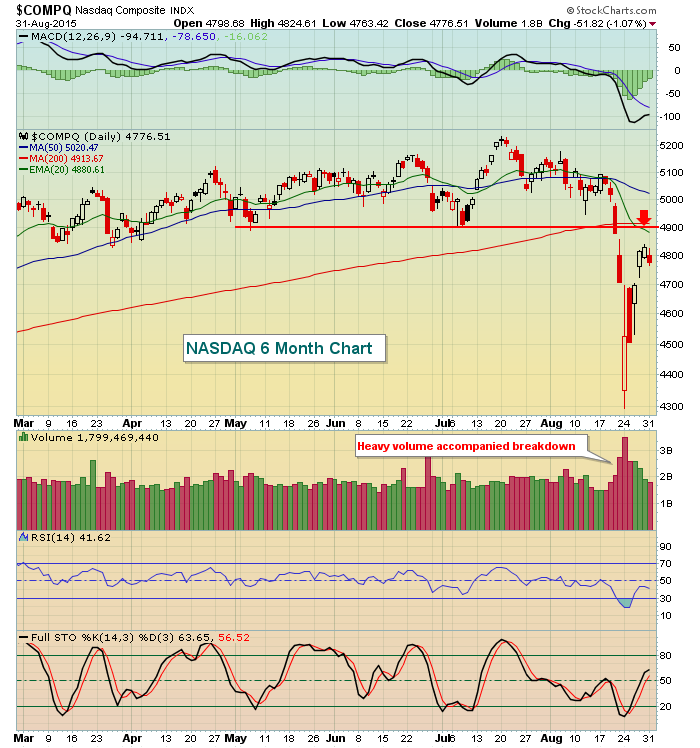
Technical sellers returned on Monday as our major indices approached key resistance areas. The NASDAQ, in particular, had penetrated into its 4800-4900 resistance area and the bulls were initially rebuffed there. Eight of the nine sectors fell on Monday with energy the only sector finishing in positive territory. Crude oil prices ($WTIC) rose sharply, but hit an area on its chart where there's been much activity over the past several months. And that's where the buying came to a halt. I realize that crude oil was beaten up badly and needed some relief, but I believe $50 per barrel oil could sway traders to the sell side given the following "volume by price" overlay. Take a look:
If you look at that volume by price bar that extends out the farthest, you should note two things. First, there's been a TON of volume to trade in this $48.00-$50.00 range over the past several months. Second, the volume has been fairly evenly distributed between buying volume (green part of bar) and selling volume (red part of bar). That suggests we'll likely see a struggle at this level. A bit of congestion, or even selling, also makes sense because crude oil has surged approximately 25% in just the last three trading days and price failed at the declining 50 day SMA on Monday. So don't be surprised if sellers become a bit more aggressive in the near-term.
Pre-Market Action
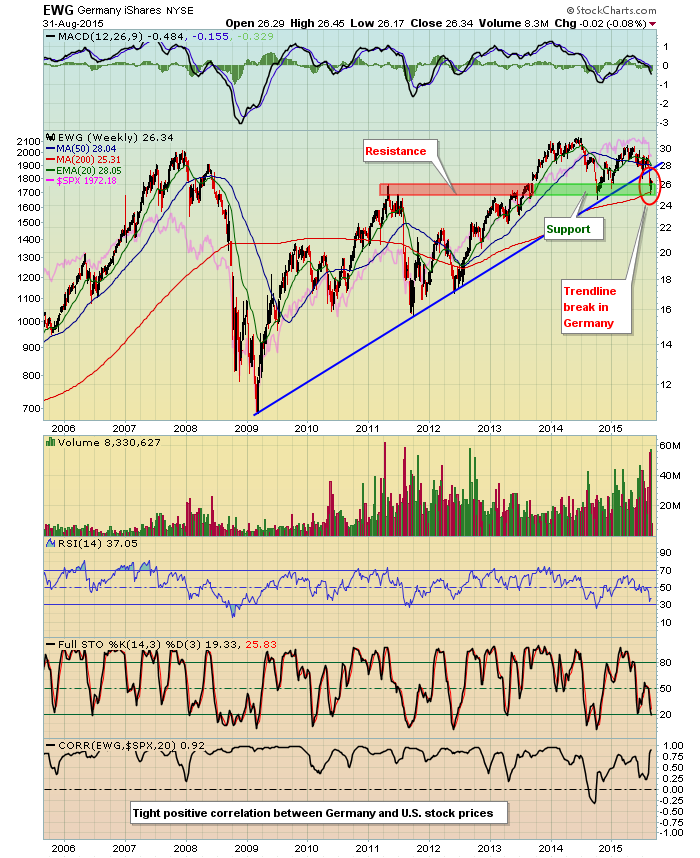
Well, sellers of U.S. equities have returned in droves this morning. Dollar Tree (DLTR) posted earnings that fell short of expectations. Despite beating on its top line, the stock was down over 5% in pre-market trading as it guided lower. The bigger development, however, was that equities around the globe were lower overnight with Tokyo Nikkei index down nearly 4%. Of course, China continues grab headlines and the Shanghai Composite fell more than 1% last night. Of all the foreign markets, however, the one I remain most interested in is Germany. From the German iShares (EWG), you can see the technical issues quite clearly below:
Since the early 2009 lows, the EWG has bounced off trendline support on several occasions.....until the past couple weeks. Trendline support was lost and now significant price support is being tested. If that's lost, it'll be hard to imagine the EWG not falling much further. The most troubling part of this for those of us trading the U.S. market is that there's been a very tight positive correlation between the direction of German equities and U.S. equities over the past decade. The correlation indicator at the bottom of the above chart shows clearly that these two indices tend to move together directionally. Therefore, it stands to reason that if Germany fails to hold support, the S&P 500 will likely follow suit. The faint pink line reflects the S&P 500 and is shown behind the EWG prices. You can click on the chart to see a live version and the settings I've used to create this chart. Based on this chart, should we see the EWG close back below the 24.50-25.00 area, be prepared for the another low in the S&P 500 to test the October 2014 low - and possibly lose that support level.
Current Outlook
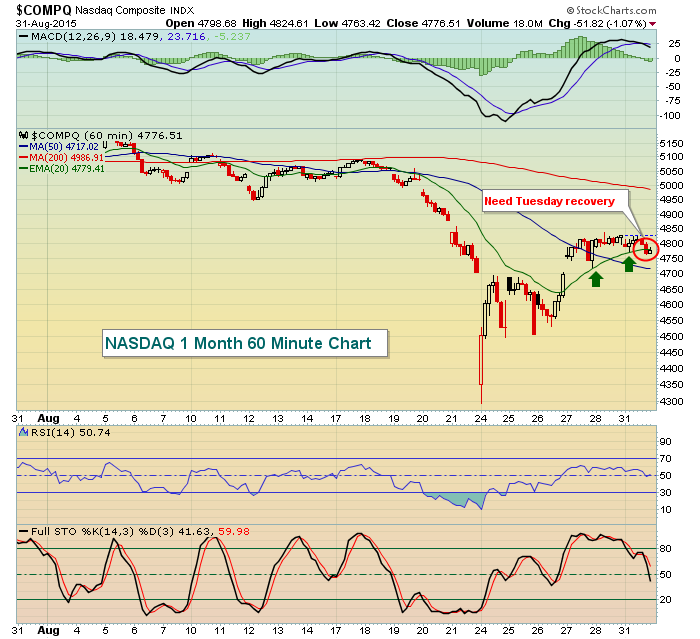
Much of the action on our major indices is squeezing between 20 hour EMAs (support) on the 60 minute charts and 20 day EMAs (resistance) on the daily chart. The long-term uptrend remains intact on most charts as October 2014 lows have held for the most part. The Dow Jones was one exception where we saw a fresh low print early last week. Even there, a quick recovery ensued and we're now well above those lows. The first chart below shows the NASDAQ's 20 day EMA being approached while the second chart reflects Monday's close very near the rising 20 hour EMA:
Sector/Industry Watch
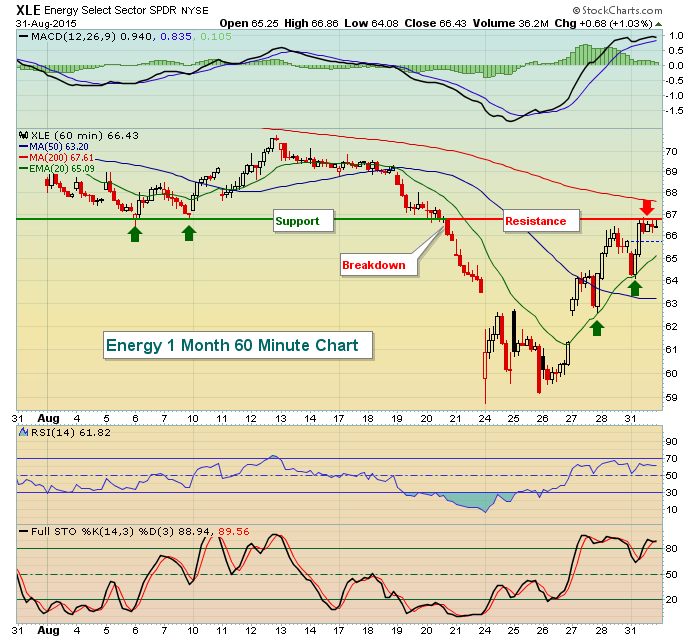
Energy had a strong day on Monday and it's had a few days of strength recently, but on the following 60 minute chart you can see there will be a challenge ahead:
The rising 20 hour EMA has been offering nice support the past couple trading sessions, but overhead price resistance could not be penetrated on Monday, which is ominous in the near-term.
Currently, all sectors are on short-term sell signals in my opinion and that won't change until we begin to see declining 20 day EMAs cleared on nice volume. The bulls have much to prove as we enter the seasonally weak month of September.
Historical Tendencies
It's typical to see the stock market perform well from the 28th of one calendar month to the 6th of the next. Over the last 65 years on the S&P 500, nearly ALL of the gains have been realized during this one third of the calendar month, which is quite astonishing. It's also worth noting that while September has few historical periods of strength, the first few days of the month qualify. September 1st through 3rd represents the only 3 day historical winning streak during the month as these three days produce annualized returns on the S&P 500 since 1950 as follows:
1st: +43.41%; 2nd: +50.36%; 3rd: +33.99%.
If the bulls can't continue the recent recovery during a favorable historical period when we generally see strong money flows, we have to wonder if they'll be able to later in the month when they'll be facing very stiff historical headwinds. Remain cautious.
Key Economic Reports
August PMI manufacturing index to be released at 9:45am EST: 53.0 estimate
August ISM manufacturing index to be released at 10:00am EST: 52.8 estimate
July construction spending to be released at 10:00am EST: +0.8% estimate
Key Earnings Reports
AMBA, $.73 estimate
DLTR, $.67 estimate (reported this morning and missed its EPS forecast and guided lower)
QIHU, $.50 estimate
Receive my morning blog article in your e-mail each and every day as soon as it's published. Just click on "Email updates" under the "Subscribe to this blog" section to the upper right of this article. Then enter your email address and hit "Subscribe". It's simple!
Happy trading!
Tom

