Market Recap for Tuesday, September 1, 2015
Off of the significant rally last week, a topping island cluster reversal pattern printed and was confirmed on Tuesday's open. This pattern, by itself, is simply a short-term reversing pattern and does not suggest a bear market is at hand. Now that short-term breakdowns have occurred and the initial rally attempt has failed, I believe it would be prudent to understand that we could be in a transitional phase in the market - from longer-term bull market to longer-term consolidation - or perhaps the start of a bear market. It's too early to call the latter. I would continue to give the benefit of the doubt to the bulls. However, trading ranges are WIDE and the Volatility Index ($VIX) is quite high so movement in the current trading range should be expected to be rapid and in BOTH directions - although the short-term technical indications would support a further decline to again test intermediate- to long-term price support.
First check out the reversing island cluster that printed on the NASDAQ on Tuesday:
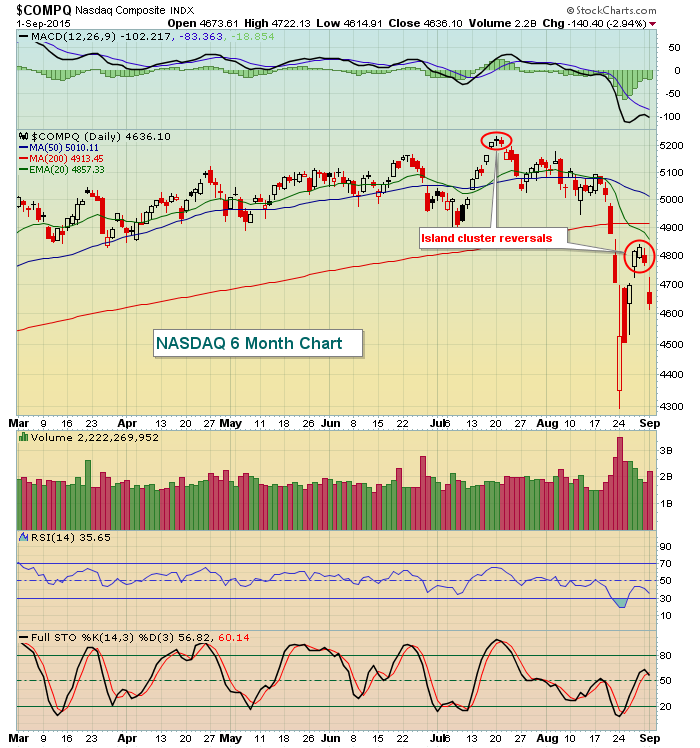
You can see that there was an island cluster reversal that marked the top in mid-July. Historically, that's the time we need to be cognizant of the potential of summertime weakness. July 17th through September 27th is the worst time of the calendar year to be long U.S. equities - based on S&P 500 data since 1950. Given that historical backdrop, we have another four weeks of historical hiccups to wade through and it doesn't help that technical conditions have deteriorated. Until we see our major indices close back above declining 20 day EMAs, I'd remain extremely cautious near-term.
Unlike Monday where energy stocks (XLE) performed well to offset the weakness of the other 8 sectors, there was no strength to be found on Tuesday. All 9 sectors closed lower with each failing to clear any significant technical resistance levels during last week's rally. Therefore, the near-term trend remains DOWN.
Pre-Market Action
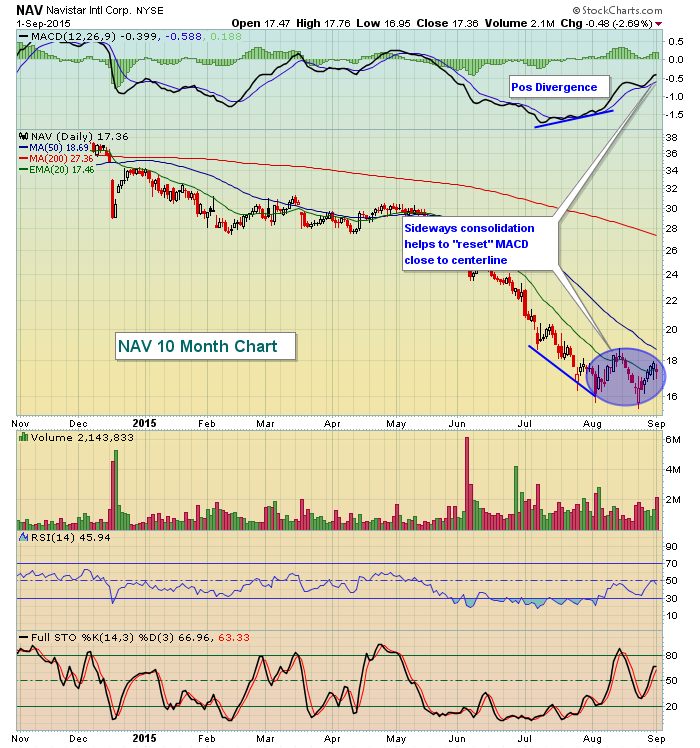
Asian markets finished down again, but did manage to close well off their lows. That provided a lift to European markets which currently are higher following yesterday's rout. One recipe not working in the U.S. market right now is lower guidance. Despite posting better than expected results after the bell on Tuesday, Ambarella (AMBA) is down more than 11% in pre-market trading as they offered cautious guidance. Navistar (NAV) posted below consensus results and looks to extend its downtrend. Recently, NAV printed a positive divergence on its MACD which suggests slowing momentum to the downside. It sideways consolidated for the past month as its daily MACD worked its way back towards a centerline "reset". Prior price support, however, at 15.65 will be tested on the open this morning with an open below that level signaling the likelihood of further weakness ahead. Check out NAV's chart:
U.S. futures are very strong this morning with our major indices looking to open up 1.5% or so. But with a VIX reading back above 31 at Tuesday's close, this yo-yo back and forth action is likely to continue in the foreseeable future, which is why I'm watching things from the sideline. You never know from one close to the next open what you might see. At least at the open, it's the bulls' turn.
Current Outlook
Day to day movements in the U.S. stock market are very difficult to predict. Instead, I look at the big picture to try to identify probabilities of movements based on technical setups. One basic principle I follow is that longer-term charts carry more weight than short-term charts. Currently, we have broken short-term price support. After a solid one week advance to approach overhead resistance, stocks again have taken a turn for the worse to begin this week's trading and it's occurred on the normally bullish 31st and 1st days of the calendar month. The confirmed island cluster reversal suggests the short-term is dicey at best with lower prices likely. The longer-term series of higher highs and higher lows, however, haven't been broken. So while you may have bearish trading strategies in place in the very near-term (and I can't blame you), just be careful if/when last week's lows and/or October lows are revisited. Do NOT assume they'll break down. Let's see it first.
4697-4761 is the gap range that separates the island cluster on the NASDAQ. We could see an open today in that range. The top of that range may be the area the sellers return - should we get there. But again with the extreme volatilty in this current market environment, please be careful.
Sector/Industry Watch
Over the past week, energy (XLE) has led the market, gaining more than 8%. Coal ($DJUSCL) is up nearly 19% while oil equipment & services ($DJUSOI) is up more than 11%. The problem? Both were extremely oversold and have now reached key resistance levels, beginning to turn lower once again. Check out both charts below:
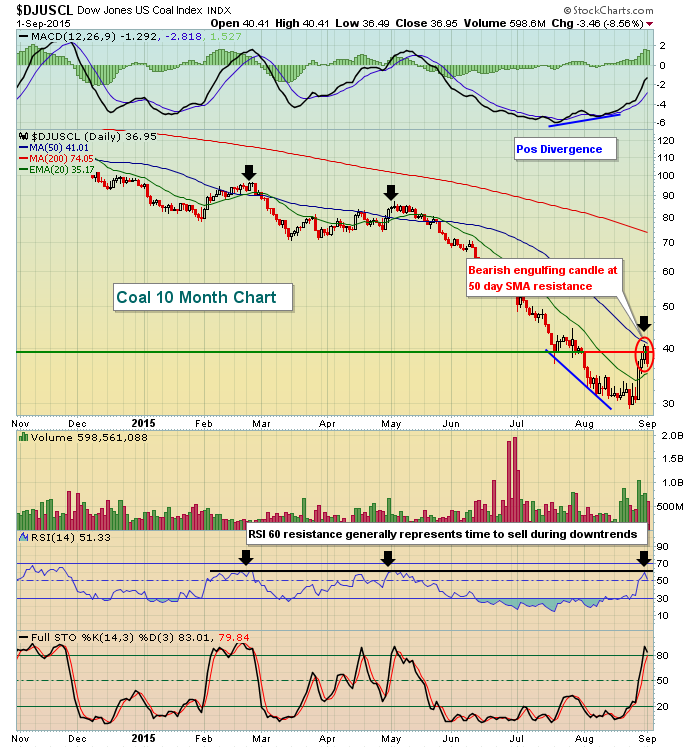
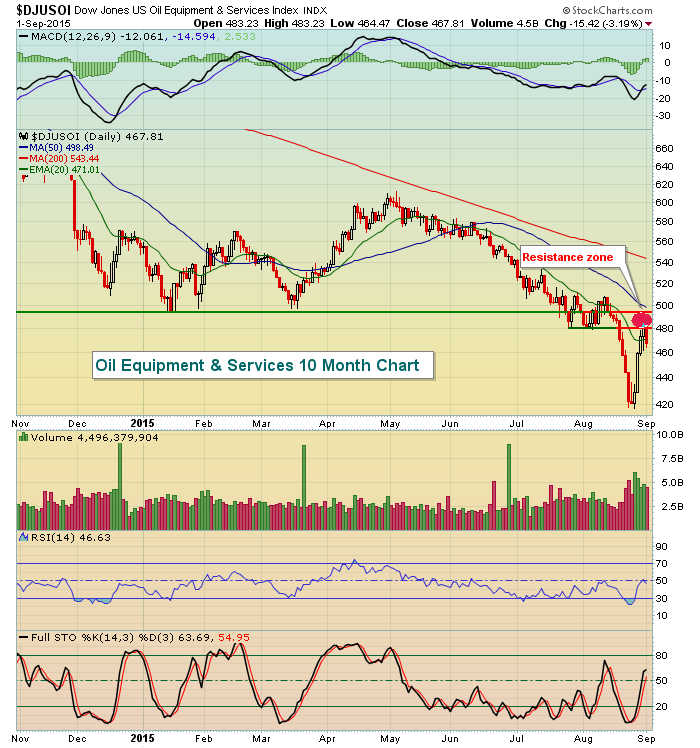
Both of these industry groups were extremely oversold so it made sense they'd see a few dollars heading their way as all other areas of the market sold off. But now that they've reached key technical resistance levels, they'll have much work to do. I wouldn't bet on a follow through above Monday highs, I'd have to see it first.
Historical Tendencies
The September "curse" for equities is well known, but we do still remain in the first week of September where history has been kind (not so much yesterday!). A lesser known historical fact is that the S&P 500, NASDAQ and Russell 2000 all perform much better Wednesdays through Fridays than they do on Mondays and Tuesdays. Mondays are historically the weakest day of the week BY FAR with annualized returns on the S&P 500 over 65 years of MINUS 15%. Wednesdays and Fridays have been the strongest calendar days of the week, posting annualized gains north of 20% over the last 65 years. There's probably much psychology behind these numbers. After all, who wants to be at work on Monday?
Key Economic Reports
August ADP Employment Report released at 8:15am EST: 190,000 (actual) vs. 210,000 (estimate)
- July ADP numbers were revised slightly lower, from 185,000 to 177,000
Q2 Productivity released at 8:30am EST: 3.3% (actual) vs. 2.8% (estimate)
July Factory Orders to be released at 10:00am EST: +0.9% estimate
September Beige Book to be released at 2:00pm EST
Key Earnings Reports
COST: $1.66 est
Happy trading!
Tom


