Market Recap for Thursday, September 17, 2015
Much ado about nothing. That's my summation of the Fed policy statement. Fed Chair Yellen decided to do nothing as apparently Fed policy is now contingent upon....just about everything. Isn't the Federal Reserve THE central bank? In stock charting, I many times refer to "analysis paralysis" where I can't pull the trigger if I look at too many indicators because I see contradictions everywhere. The Fed now seems to be stuck in analysis paralysis. Let's warn for months about an impending rate hike, then discuss all the reasons why we couldn't pull the trigger. But leave open the possibility of pulling the trigger at some future date IF all the stars align perfectly. Whatever.
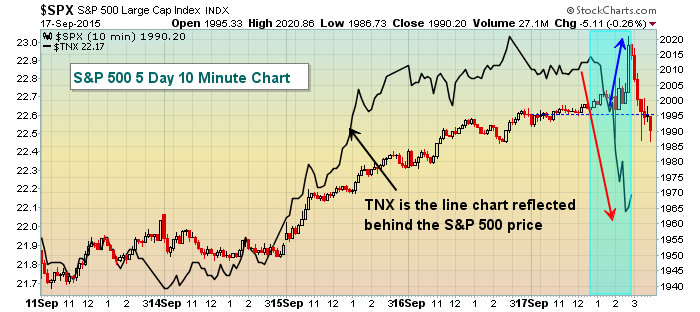
While the policy statement itself was quite boring, action in both treasury and stock markets were anything but boring. I had said leading up to the announcement that doing nothing would be bearish for U.S. equities. So you can imagine my confusion for the first hour after the announcement as our major indices soared! What was really perplexing was the fact that treasury yields were plummeting at the same time. Normally, we see the S&P 500 and treasury yields moving in unison. Not yesterday afternoon. Take a look at this intraday chart of the S&P 500:
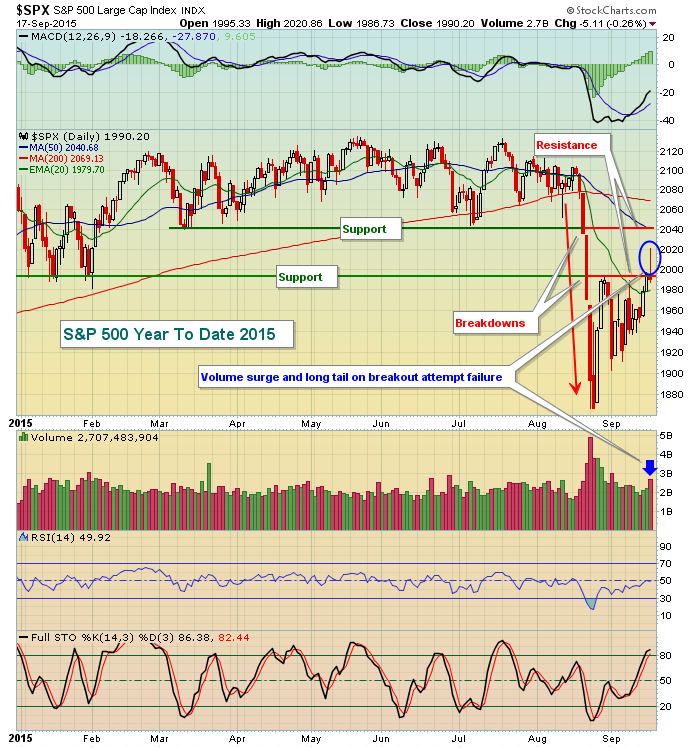
The blue shaded area highlights the insanity. Watching the treasury yield drop while equity prices soared reminded me of quantitative easing (QE) that began in 2010. Treasury prices and stock prices were rising simultaneously (rising treasury prices result in lower yields). It didn't last long, however. Once the bond market closed at 3pm EST, stock traders came to their senses and the final hour of selling began. By the time all the madness had ended, the S&P 500 finished at 1990, a one point breakout above the 1989 closing resistance level I provided in my Wednesday blog report. That long tail to the top side, however, is a sign of failure and possible reversal so I'm not overly optimistic with this "breakout". Look at the bigger picture year-to-date on the S&P 500:
1990 and 2040 represent two key levels of price resistance on the S&P 500 and it was well on its way of clearing one of those hurdles with an hour left in the trading day on Thursday. So close.
Pre-Market Action
U.S. futures are pointing to a sharply lower open, following the lead of European indices this morning. Disappointment abounds after the Federal Reserve decided there were too many risks to raising the interest rate a quarter point. It shows a lack of confidence in what the Fed has been saying is a strengthening economy. From a technical perspective the news yesterday was bad as well - due to that high volume reversal in the final hour of trading. Many breakout attempts on our major indices, sectors and individual stocks failed as a result. Whenever I see a high volume reversal like that after an intraday breakout has been established, I assume market makers are the primary culprits. If they're short, you don't want to be long.
Keep a close eye on treasury yields. Money rotated into treasuries on Thursday afternoon with the 10 year treasury yield ($TNX) tumbling more than 8 basis points. It's down another 6 basis points this morning with the TNX at 2.16% at last check. This is further evidence both the stock and bond markets are concerned about weakening economic conditions. On a related note, caution and fear are on the rise with the Volatility index ($VIX) approaching 24 in pre-market action after moving as low as 17.87 on Thursday afternoon.
Among technology names.....Adobe Systems (ADBE) beat Wall Street consensus estimates for both revenue and EPS, but their guidance came up short and the stock is down in pre-market trading. Texas Instruments (TXN) raised their dividend and increased their share buyback, but it's failed to lift the semiconductor stock as global economic fears rule the headlines this morning.
Current Outlook
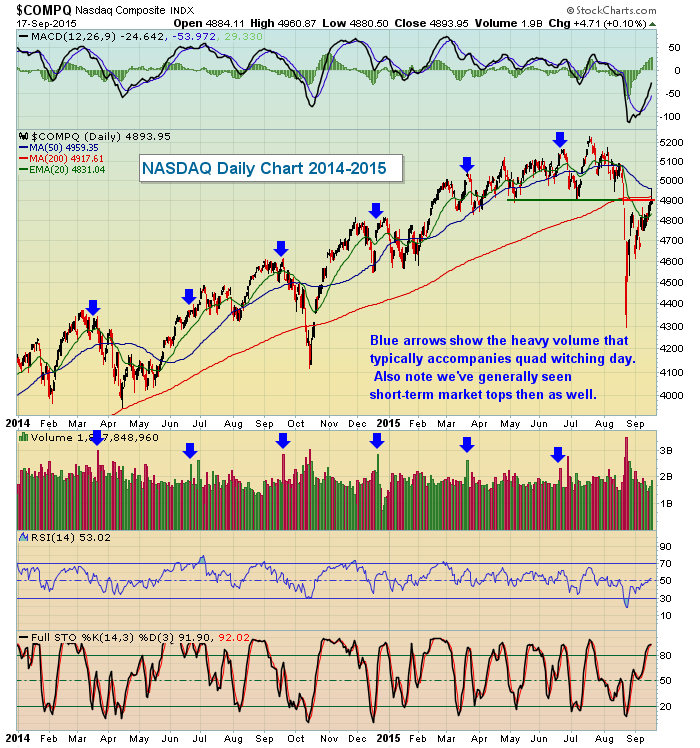
If Fed Day wasn't enough excitement for you, today we have quadruple witching, which represents the expiration date of stock index futures, stock index options, stock options and single stock futures. The expiration of all four simultaneously occurs once every three months - in March, June, September and December. Traders must close out their positions so we typically see heavy volume accompany quad witching days. I've provided a 2014-2015 chart of the NASDAQ to illustrate two points:
My first point - and I'll give credit to Greg Schnell for providing me a similar chart yesterday - is that volume is extraordinarily high on quad witching days. But perhaps the bigger (and second) point is that the NASDAQ printed short-term tops on or near quad witching day in five of the last six quarters. Given that backdrop, Thursday's long tail and potential reversing candle carries more weight. Finally throw in next week's historical annualized returns from September 21-25 on the NASDAQ (see Historical Tendencies below) and we certainly have plenty to be cautious about.
Sector/Industry Watch
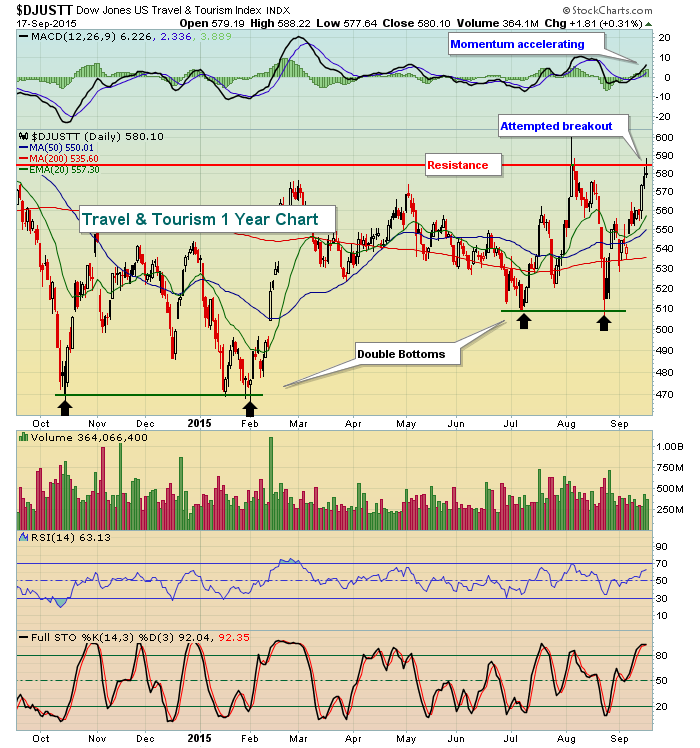
Utilities were the clear winner on Thursday among sectors as this group definitely benefits from a drop in treasury yields. The Fed's failure to hike rates boosted most utility stocks as their dividend yields looked more appealing to income-oriented investors. Healthcare also received a boost as biotechs finished up more than 1% for the session. The only other sector to finish in positive territory was consumer discretionary. Home construction was the leading industry group, likely buoyed by the Fed's no interest rate change policy stance. Travel and tourism ($DJUSTT) was the industry group that caught my eye, however, as it threatened to make a breakout to 2015 highs and has been consolidating in a bullish rectangular pattern for 18 months. Here's a chart of the past year:
Leading the charge in this space has been Expedia (EXPE), which gapped higher in late July with earnings and subsequently retraced and filled that gap. It's now surging once again on strong volume and a strengthening MACD. Clearly, EXPE is one of the best performing stocks in the market and it's providing the travel and tourism industry much relative strength.
Historical Tendencies
For the next few days, I'll continue posting the information below as a reminder that we're entering a period of notable historical weakness. This NEVER provides us any type of guarantee, but rather helps us to manage our risk. Since 1971, these are the annualized returns on the NASDAQ for the period September 21-25. Ignore it at your own risk:
September 21 (Monday): -92.11%
September 22 (Tuesday): -83.40%
September 23 (Wednesday): -41.45%
September 24 (Thursday): -18.48%
September 25 (Friday): -53.51%
Key Earnings Reports
None
Key Economic Reports
August leading indicators to be released at 10:00am EST: +0.2% (estimate)
Have a great weekend and happy trading!
Tom


