Market Recap for Friday, September 18, 2015
Traders were not thrilled by the Federal Reserve's decision to leave interest rates unchanged as they quickly turned their attention to defensive bonds. The 10 year treasury yield ($TNX), after closing above 2.30% for the first time in two months last week, suddenly plunged back to Friday's close of 2.13% and that's not a good sign for equities. While equity prices and the TNX do occasionally diverge (ie, quantitative easing), it's not the norm. And it makes sense that the two would tend to move in the same general direction because a drop in treasury yields means traders are buying bonds. Typically, you want to own bonds if you believe the economy is slowing. If that's the case, you don't want to own equities as they'll likely head lower to anticipate lower profits. Let's take a look at how the last several days unfolded comparing the TNX (pink line) to the S&P 500:
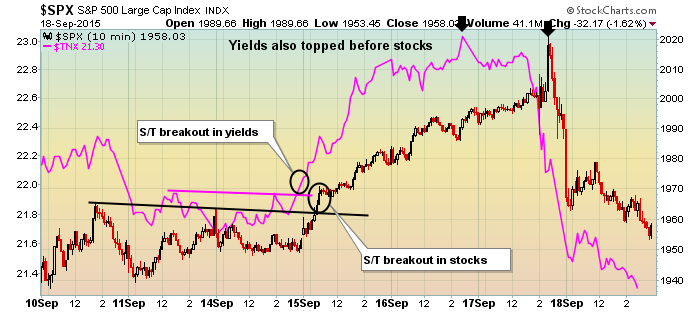
Note that in anticipation of a possible rate hike last Thursday, the TNX broke out late in the day on Tuesday. The very next morning, the S&P 500 did the same and rallied strongly into the Fed meeting. Perhaps the most interesting development on this chart, however, was the top in treasury yields on Wednesday, one day before the Fed inaction and also one day before the plunge in S&P 500 prices. And if you look to the far right side of the chart, you'll notice the treasury yield continued to plunge right up until the close. That's a LOT of treasury buying and that doesn't bode well for equity prices near-term. Obviously, stock traders would like to see treasuries sold this week (with a resulting pop higher in yields) so those proceeds can be used to fuel a stock market rally. Given the technical conditions and historical tendencies currently, I don't like the odds of that but it's the stock market and ANYTHING can happen. We just have to be smart about managing our risk as traders. Technical indications and history simply tell me to be very cautious right now. It's certainly not the time to be overly aggressive on the long side.
All nine sectors were lower on Friday with energy leading the charge, dropping 2.63%. Utilities and consumer staples were the relative outperformers, losing just 0.56% and 1.16%, respectively.
Pre-Market Action
On Sunday evening, it appeared it might be a very rough start to the week for U.S. equities as futures were solidly in the red. Futures have reversed course, however, and are now pointing to a nice start to the week. Likewise, treasury yields have moved back up to 2.17% at least for now showing a temporary rotation away from treasuries and into equities. That relationship always bears watching and especially now on the heels of last week's Fed announcement.
Homebuilders ($DJUSHB) are likely to see a boost today as Lennar (LEN) reported quarterly revenues and profits that both exceeded consensus estimates. The DJUSHB has been one of the leading industry groups of 2015 and based on current technical conditions appears poised to continue leading the action. Here's the chart:
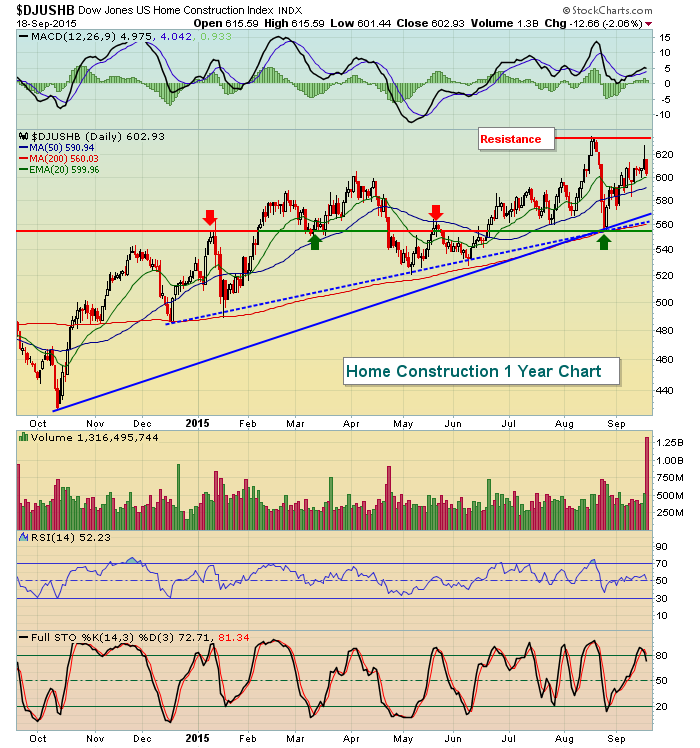
The solid blue line represents the longer-term trendline that connects the October 2014 and August 2015 lows while the dotted blue line represents a more intermediate-term trendline that connects multiple lows since December 2015. Both of these trendlines currently intersect the 560-570 range. The horizontal resistance/support line shows the 555 level to be significant as well and the August low close was 555.67. Clearly, that 555-570 range will be one to be respected on any extended selling in the group. To the upside 634.08 is the target as that was the closing high on August 19th.
Current Outlook
I'm very cautious near-term. I believe the Federal Reserve made a big mistake last week by not raising interest rates a quarter point. The effect of the rate hike would have been minimal but it would have sent a psychological message to traders that they believe our economy will continue to strengthen during the fourth quarter. Instead, they sent the message that they don't know and that there's a ton of uncertainty out there. If there's one thing the stock market does not like, it's uncertainty and that came across quite clear in the final hour on Thursday and throughout the day on Friday. Can the bulls now rally their troops? This week will be a big test given further technical breakdowns and historical headwinds.
On the NASDAQ, there are certain levels to keep an eye on to both the upside and downside. First, let's look at a one year chart:
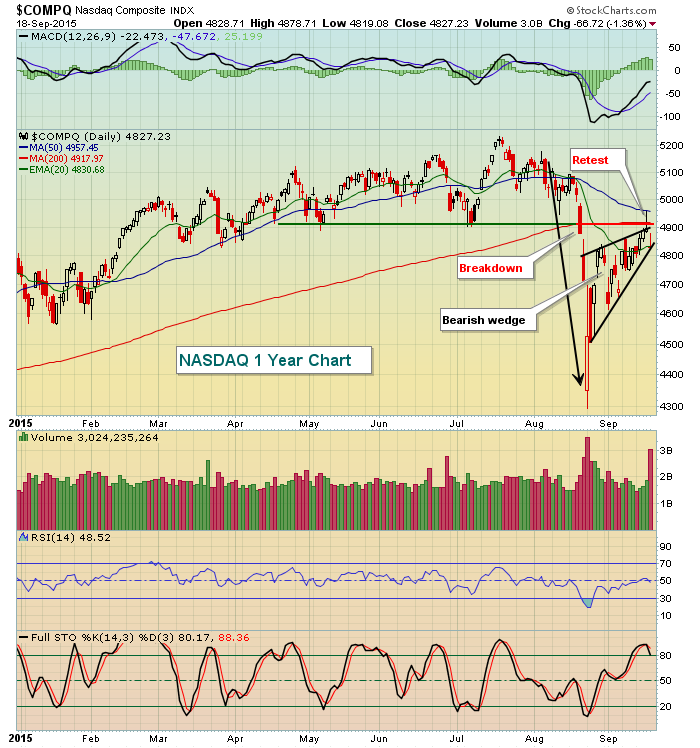
The recent uptrend line connects closing prices and shows that another close beneath Friday's would be problematic, breaking trendline support and bearish rising wedge. Heavy volume would add to the issues. Resistance is just above 4900 where we saw that long tail print last Thursday after that post-Fed announcement final hour collapse.
On an intraday chart, the NASDAQ shows one different area of price resistance that must be negotiated:
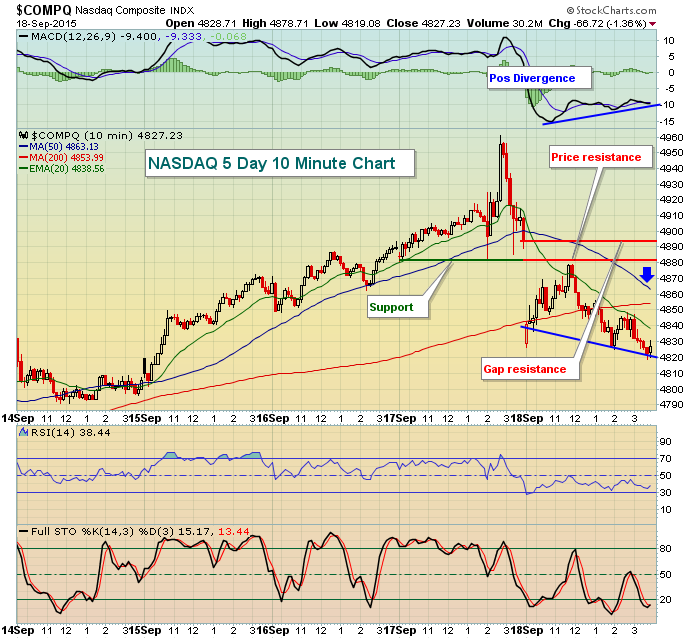
A couple points on this chart:
(1) The initial selling last Thursday immediately after the Fed announcement approached 4880 with another drop an hour later to 4885. That established short-term support so when we gapped lower on Friday, that 4880-4885 support level became short-term resistance. Note the rally attempt on Friday failed as the NASDAQ neared 4880. The bulls will have a tough job here in the near-term. Also, that gap on Friday now leaves gap resistance at 4894 IF the 4880-4885 level is cleared. Then go back to the daily chart and you'll see price resistance just above 4900. So expect lots of sellers ahead.
(2) There's a positive divergence that's formed suggesting that very near-term selling momentum has slowed. I normally look for 50 period tests (blue arrow) to alleviate the slowing momentum issue and that level, as of Friday's close, was 4863.
Sector/Industry Watch
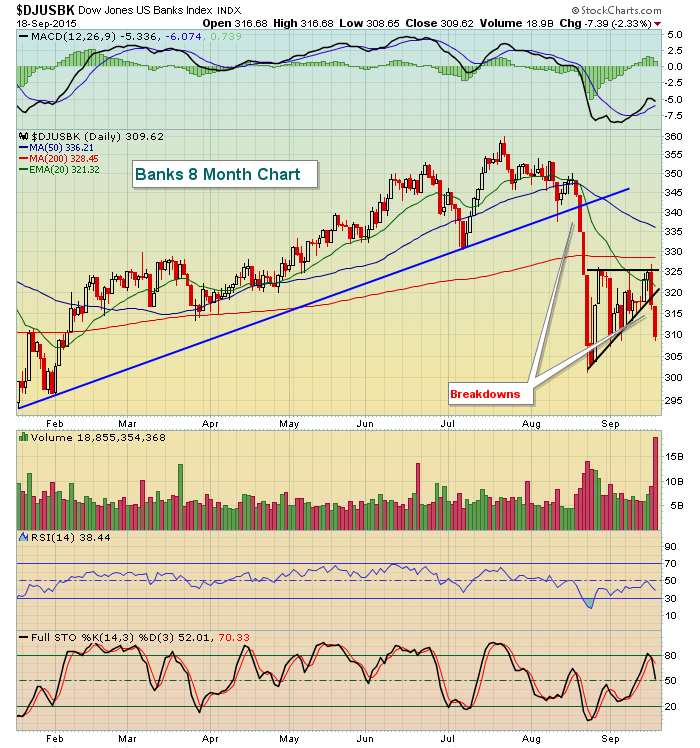
The Fed's inability to pull the trigger on a quarter point hike hurt no industries any harder than banks ($DJUSBK) and life insurance ($DJUSIL). Both of these groups look to higher rates for increased profitability so it shouldn't be too surprising to see the reactions on both of these charts since Thursday.
Banks:
Life insurance:
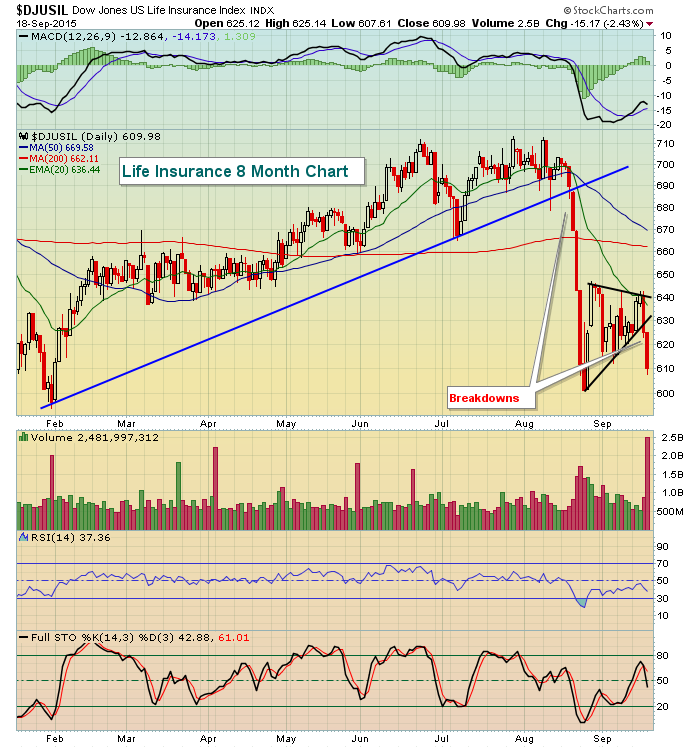
The financial sector (XLF) isn't far from breaking down beneath August lows and banks and life insurance companies are leading to the downside unfortunately. Poor performance from financials on a relative basis, especially banks, is a warning sign for the stock market. It's difficult for stock prices to climb when bank earnings growth slows as they tend to become much more conservative. That will many times lead to tighter credit. Many companies need access to credit to grow their business so it's a vicious cycle. There's still time to correct this issue, but the performance of financials always bears watching.
Historical Tendencies
Once again, here's a reminder of the seasonal trouble we sometimes run into during the second half of September. Below are the annualized returns on the NASDAQ for each calendar day since 1971:
September 21 (today): - 92.11%
September 22 (Tuesday): -83.40%
September 23 (Wednesday): - 41.45%
September 24 (Thursday): -18.48%
September 25 (Friday): -53.51%
Key Earnings Reports
LEN: $.96 (actual) vs. $.79 (estimate)
RHT: $.29 (estimate) - reports after the close
Key Economic Reports
August existing home sales to be released at 10am EST: 5.5 million units (estimate)
Happy trading!
Tom


