Market Recap for Wednesday, September 2, 2015
The bulls did not crumble on Wednesday. After a big gap down on Tuesday with the market closing at or near its lows of the day, there was the opportunity for the bears of another serious gap lower and rout on Wednesday, but it never materialized. Instead, the recent high volatility again made the morning very unpredictable, this time with the bulls in charge at the opening bell. The problem is that technically most areas of the market are broken so the early strength didn't last. But rather than give in to more selling Wednesday afternoon, the bulls made a stand and all of our major indices rallied into the close. Was it enough to actually turn the tide? Not yet, but it's a start.
Expect volatility. That's what a VIX in the 20s and 30s tells us. As long as the VIX remains elevated, this back and forth action is here to stay and the bias in equity prices will be lower. We did see the VIX falling rapidly in afternoon action. The initial gap higher in equity prices caused an opposite reaction in the VIX - a gap down of 6-7% below 30. It looked as though the market strength was failing after one hour, however, as the VIX climbed back above 30. From there, the bulls took over, prices rose and the VIX steadily declined as it fell approximately 14% from its intraday high. If you're on the long side, you want to see volatility subside quickly as it did after the steep drop in October 2014. Check it out:
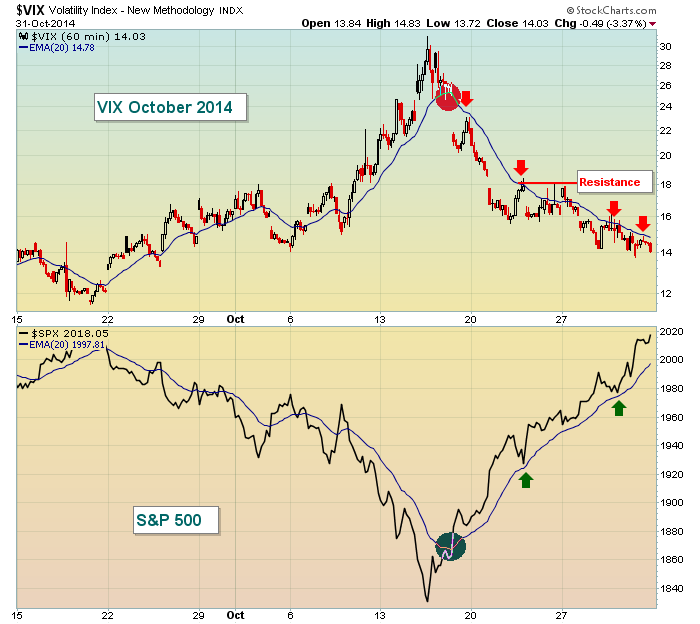
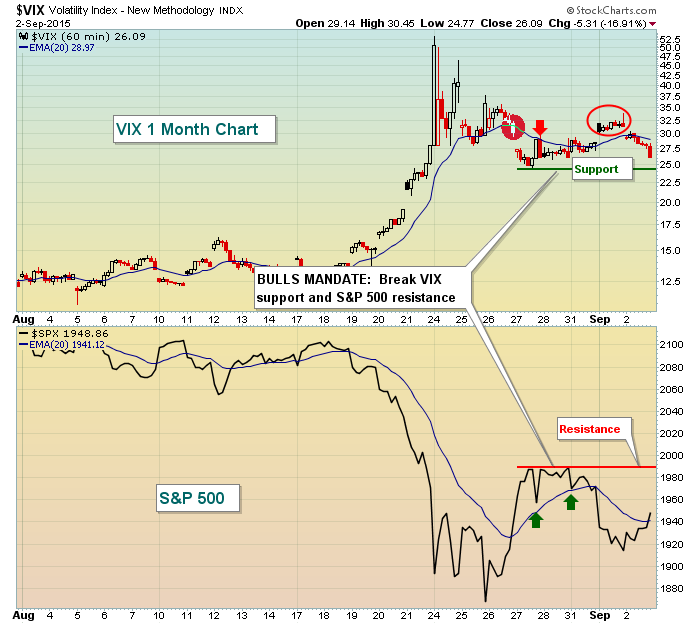
The action in October 2014 was more predictable and reliable than what we've seen recently. The VIX spiked with the September and October weakness, but that volatility quickly came back down consistently as the S&P 500 formed a "V" bottom and the bull market resumed. Currently, we have a different picture. First, as you can see below, the VIX is remaining elevated much longer and it hasn't broken initial price support to the downside. In the Current Outlook below in this report, you'll see the combination of price resistance and the declining 20 day EMA in the 1990-2003 "zone". The S&P 500 needs to clear that zone with the VIX falling back into the teens. That combination would likely encourage more technical buyers from the sidelines. Check out the 2015 version of the rising volatility along with the recent S&P 500 drop:
Pre-Market Action
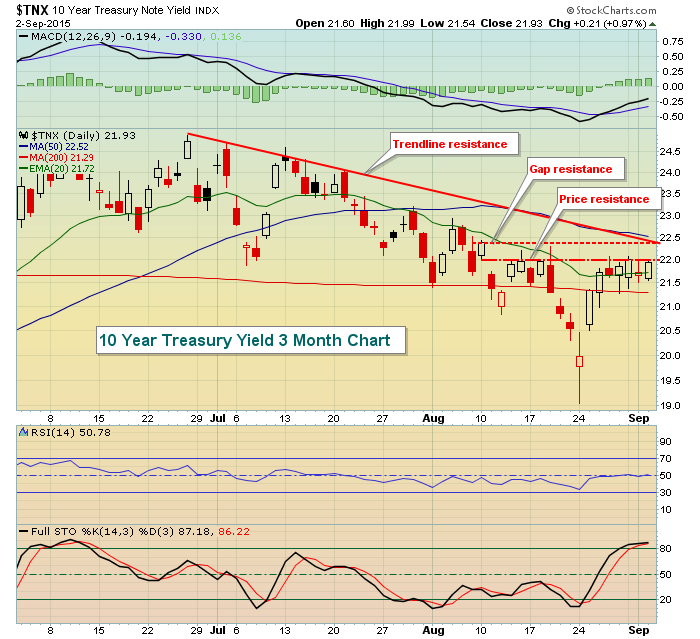
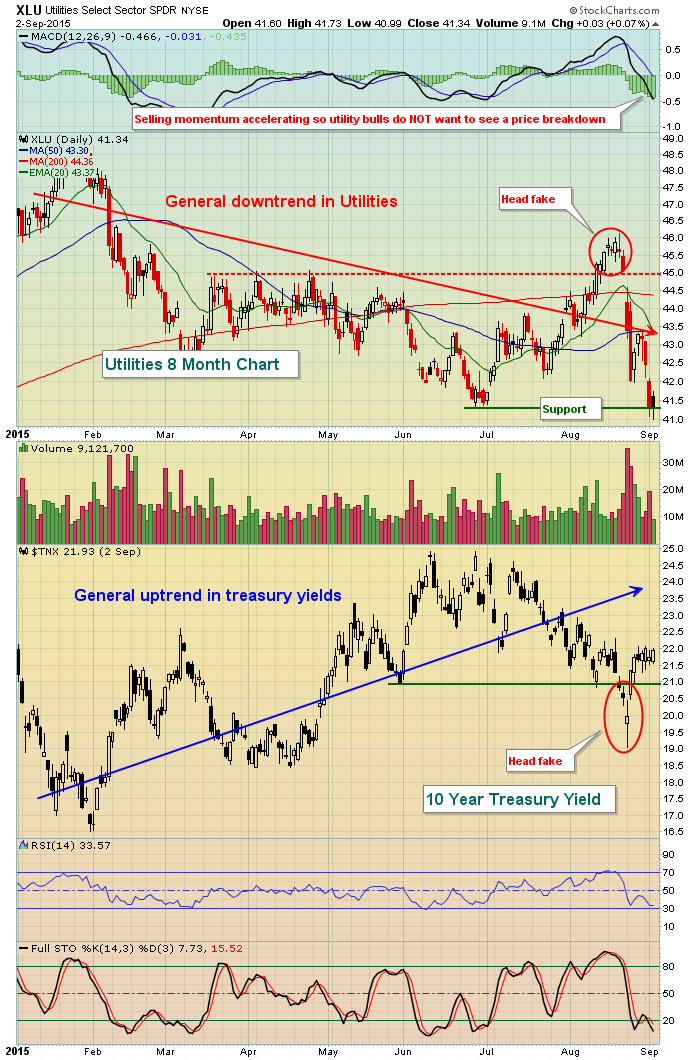
The U.S. market looks to extend the gains enjoyed on Wednesday. Futures this morning are pointing to a gap higher of perhaps 0.5% to 0.75% although as we've seen lately, that can change in a hurry. The 10 year treasury yield ($TNX) could provide us short-term clues as the TNX continues to bump against resistance in the 2.20%-2.25% range. A break to the upside would mean that money is flowing away from the defensive treasuries and provide more ammunition for equity bulls to clear upcoming price resistance levels. However, the opposite movement in the TNX would likely have a bearish effect on equities at a time when that market doesn't need any more negativity. Here's the 3 month chart on the TNX:
Current Outlook
Wednesday's gains totaled nearly 300 points on the Dow Jones with more than a 100 point gain on the NASDAQ. Sectors leading the rally were technology, industrials and consumer discretionary, three of our aggressive sectors. All nine sectors rose so there was wide participation. Futures today are higher. What could be bad about this scenario, right? Well, a few things. First of all, it's September and today marks the end of the only historical three day winning streak we enjoy. In other words, over the past 65 years on the S&P 500, there is not another consecutive three day period in September that boasts positive annualized returns. September 1st through 3rd is IT. September scares me. And short-term technical weakness adds to it. While the sudden strength in aggressive sectors helps to alleviate a bit of the fear, let's be mindful of the fact that the VIX does remain elevated and we have critical 20 day EMA tests awaiting traders at just about every turn. Here's the short-term chart on the S&P 500:
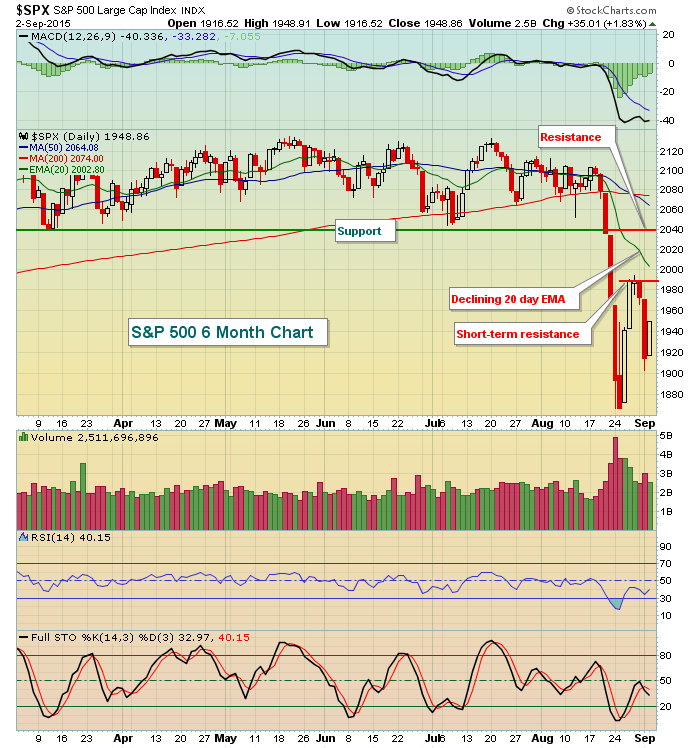
We have more room to the upside technically, but with every point higher, the major short-term tests draw nearer.
Sector/Industry Watch
As mentioned above, all sectors finished higher on Wednesday. Nearly every industry group followed suit. So which sector or industry groups look interesting on Thursday? Well, let me start with the sector. Utililties (XLU) have been under fire of late as treasury yields have been rising again. But I showed you key technical resistance on the TNX above. If that resistance holds and yields begin to fall, then utilities should benefit. They're sitting almost squarely on price support so pay close attention to the treasury yield. Here's the precarious technical situation the XLU faces as the trading day begins:
From an industry group perspective, check out the computer hardware ($DJUSCR) space:
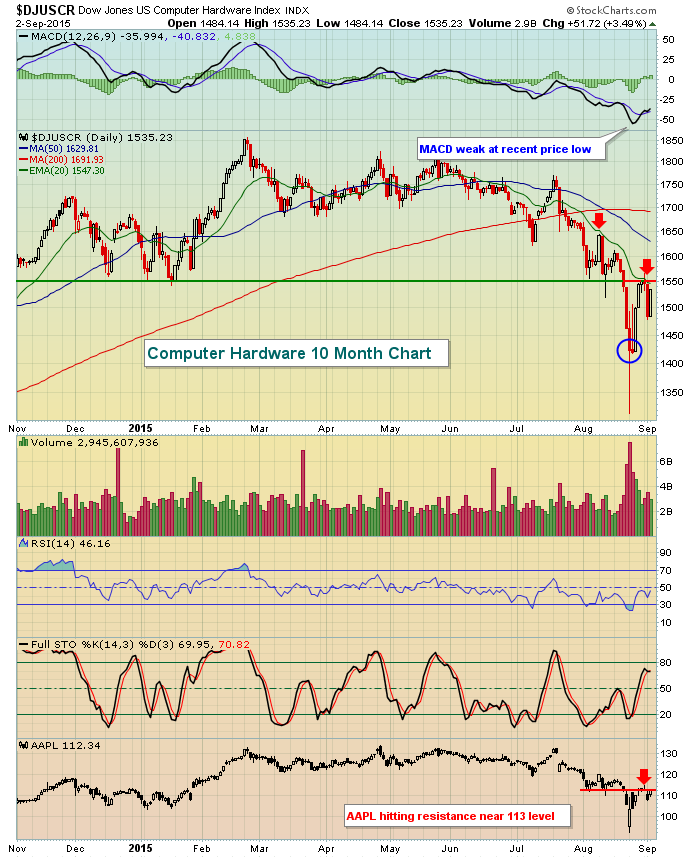
Apple (AAPL) is a leader and an obviously important component of the computer hardware group. AAPL is up against price resistance (112.50) and its 20 day EMA (just below 113.00). This is going to be a VERY interesting test for both AAPL and its peers. Based on the high volume breakdown in the near-term, I would assume this test fails - until it doesn't.
Historical Tendencies
I've discussed many of the problems the U.S. market faces during the month of September. To give you a few numbers, check out the following annualized returns (on the S&P 500 since 1950):
September 4th (tomorrow): -34.58%
September 8th (next Tuesday): +9.70%
September 9th (next Wednesday): -49.86%
September 10th (next Thursday): -16.50%
September 11th (next Friday): +1.08%
The historical headwinds are about to grow a little bit stronger beginning tomorrow. It doesn't mean the market will move lower, it simply makes it more difficult when combined with the technical issues. That's why it'll be important to see the market perform well today - to clear technical hurdles.
Key Economic Reports
Initial jobless claims: 282,000 (actual) vs. 273,000 (estimate)
August PMI services index to be released at 9:45am EST: 55.2 estimate
August ISM non-manufacturing index to be released at 10am EST: 58.5 estimate
Tomorrow we'll see the August employment report at 8:30am EST with an estimate of 223,000 nonfarm payrolls.
Key Earnings Reports
JOY: $.54 (actual) vs. $.60 (estimate)
MDT: $1.02 (actual) vs. $1.01 (estimate)
JOY is down nearly 8% in pre-market trading while MDT is fractionally higher.
Happy trading!
Tom


