Market Recap for Wednesday, September 23, 2015
The S&P 500 keeps trying to regain its footing as it watched its German counterpart (DAX) lose August support two days ago and then fail to recapture that support level on Wednesday when it had the opportunity. 9648 was that August low close on the DAX. It eclipsed that level, closing at 9570 on Tuesday. Yesterday, the DAX was up intraday as high as 9712 - back above that 9648 level - only to fail to hold it and close at 9612. I've been writing and talking about the technical issues on the DAX for weeks and for those of you that are new to the discussion, it impacts the S&P 500 for one big reason. Take a look:
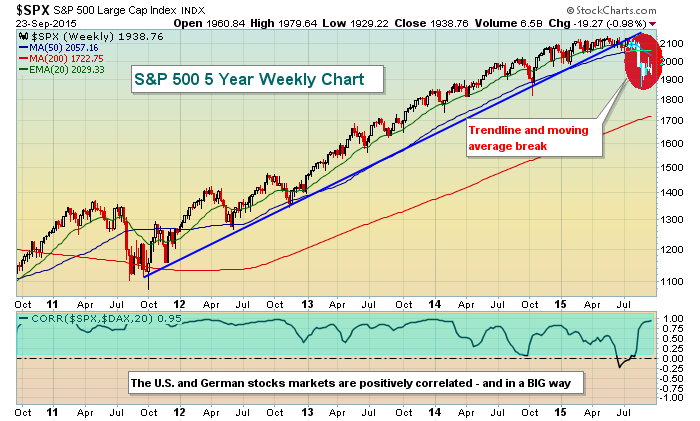
The technical breakdown in the near-term on the S&P 500 is obvious and highlighted in red above. But the bigger problem, in my view, is that there is very strong positive correlation between the S&P 500 and the German DAX and the DAX is in far worse shape near-term than we are. That blue shaded area above highlights the fact that the correlation indicator has been in positive territory nearly every week over the past five years. Furthermore, many readings are at or approaching 1.0, which essentially tells us that these two indices are moving hand in hand together. Check out the DAX:
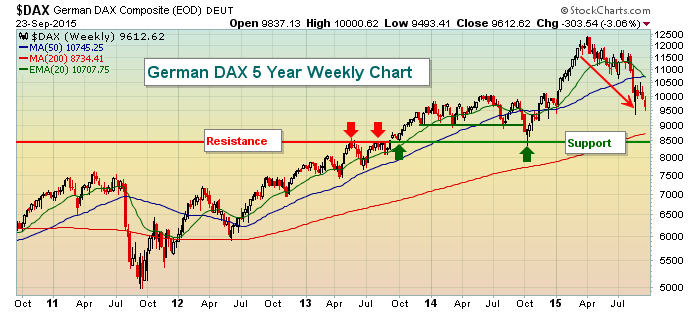
So I believe it's fair to say that weakness in Germany is likely to translate to further weakness here in the U.S.
Utilities led the action on Wednesday as that group, technology, consumer staples and financials all eked out small fractional gains. The remaining five sectors were losers with energy and materials by far the weakest. Materials lost 2.13% on the session as nonferrous metals ($DJUSNF) lost more than 5% in yesterday's trading - half of the 10% gain it had enjoyed over the prior month.
Pre-Market Action
At last check, the German DAX was down another 1.75% in early morning trading, leading European indices lower across the board. That continuing weakness is spilling over to U.S. futures with the S&P 500 set to open 0.75%-1.00% lower, although we know that can change quickly. From the above chart on the DAX, it would appear that index is heading for a test of support near 9000. If that fails, a HUGE test closer to 8500 (October low) is on the horizon. Knowing how tightly correlated the S&P 500 is with the DAX, the last thing we want to see is the October low being lost on either index.
Accenture (ACN) topped quarterly earnings expectations, but guided next quarter's revenues lower. In early trading, ACN is trading down close to 4% as traders overlook the company's decision to raise its dividend by 8% and add to its share repurchase program.
Current Outlook
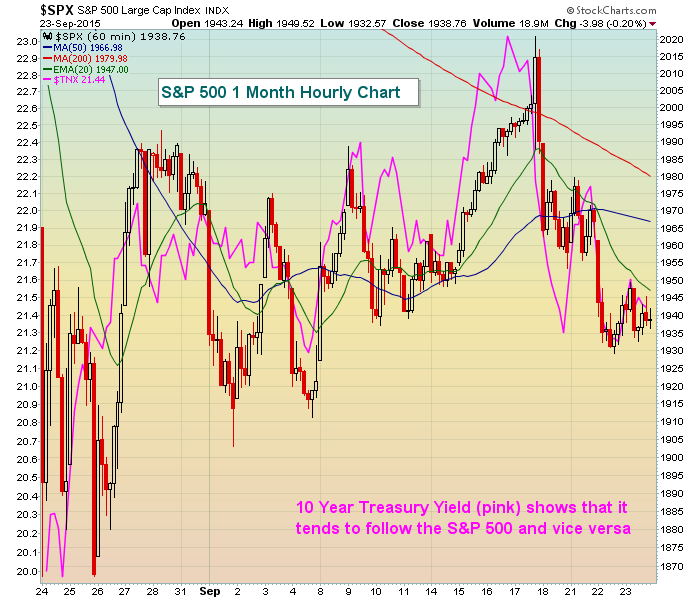
It's difficult to be anything but bearish here in the short-term. We have technical breakdowns galore. We're in the midst of one of the worst weeks historically of the year. Germany is providing us stiff headwinds to overcome. And money is rotating to treasuries. Speaking of treasuries, keep an eye on the 10 year treasury yield ($TNX). Stock prices and treasury prices tend to move opposite one another. And since yields move inversely to treasury prices, it makes sense that stock prices and treasury yields tend to move in sync with one another. Knowing that, don't ignore a breakdown in the TNX below the 2.10%-2.12% support zone. In pre-market action, the TNX has fallen to 2.11% from 2.14% and that does not bode well for U.S. stocks today. Further deterioration in the TNX could lead to very heavy selling in stocks.
First, let's simply look at how the S&P 500 and TNX tend to track each other:
With that fairly tight correlation between the S&P 500 and the TNX in mind, now let's check out the technical prospects of the TNX:
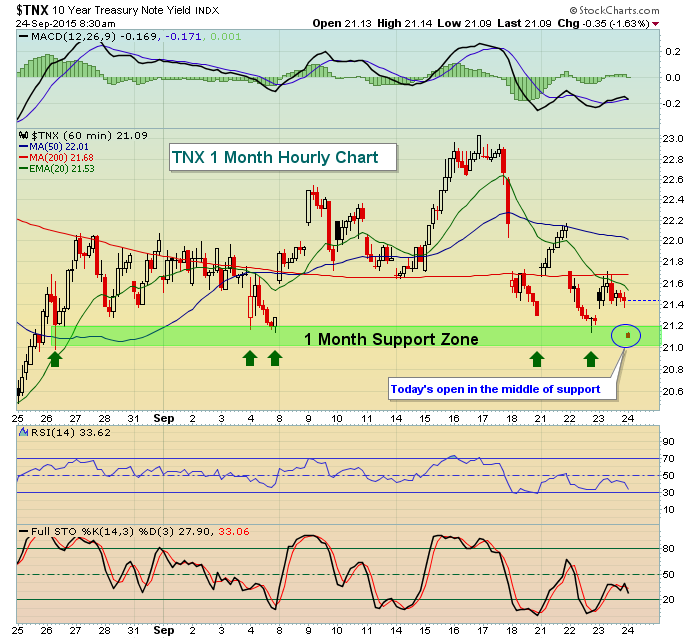
The TNX, along with the German DAX, represent two key markets we need to pay VERY close attention to as they both could be signaling much more weakness ahead for U.S. equities.
Fed Chair Janet Yellen will be speaking at 5pm EST today and that could have a significant impact on treasury prices and yields, not to mention U.S equity prices. The entire technical picture surrounding stocks and bonds could reverse so please be aware of that. After the latest FOMC policy statement, many economists were quite confused about when or if the Federal Reserve would be raising interest rates. That uncertainty has led, in part, to much of the volatility and market weakness of late - in my opinion. If Fed Chair Yellen offers up a little more transparency this afternoon, it could soothe the markets. We'll see.
Sector/Industry Watch
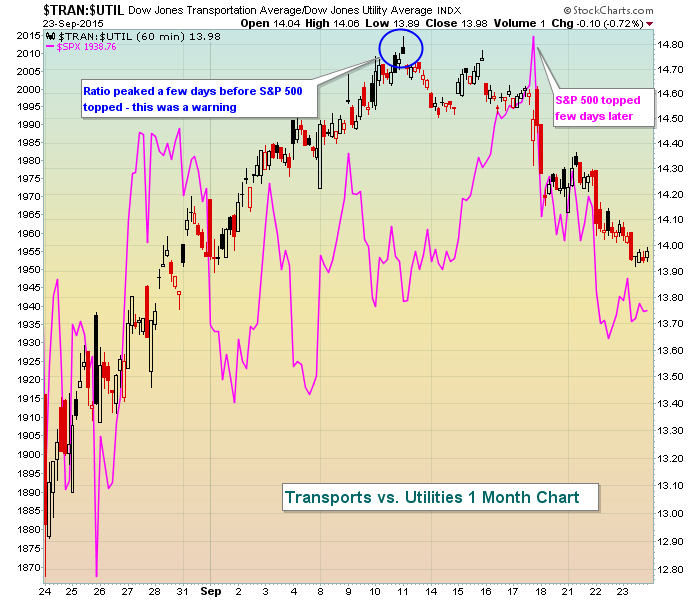
Let me give you one more chart to worry about. It's the recent decline of transportation stocks vs. utilities. When our economy is expected to strengthen, money should be flowing much more towards transportation stocks and the ratio of the $TRAN:$UTIL should rise. When the opposite is true, this ratio should decline. Take a look at the recent action in this ratio as the S&P 500 has attempted to move higher recently:
Historical Tendencies
Okay, I promise this will be the last time, but here's a final reminder of the bearish historical period that we're trying to get through. The following represents the annualized returns on the NASDAQ since 1971 for each of the following days this week:
September 21 (Monday): -92.11%
September 22 (Tuesday): -83.40%
September 23 (yesterday): -41.45%
September 24 (today): -18.48%
September 25 (Friday): -53.51%
We've seen a lot of negativity this week, supporting the above numbers. However, always remember that history never provides us any type of guarantee. I use historical information as just another "indicator", helping me to make smarter trading decisions - nothing more.
Key Earnings Reports
ACN: $1.15 (actual) vs. $1.11 (estimate)
BBBY: $1.21 (estimate)
JBL: $.35 (estimate)
NKE: $1.19 (estimate)
BBBY, JBL and NKE all report after the close today
Key Economic Reports
August durable goods released at 8:30am EST: -2.0% (actual) vs. -2.0% (estimate)
August durable goods ex-transports released at 8:30am EST: +0.0% (actual) vs. +0.3% (estimate)
Initial jobless claims released at 8:30am EST: 267,000 (actual) vs. 275,000 (estimate)
August new home sales to be released at 10:00am EST: 515,000 (estimate)
Happy trading!
Tom


