Market Recap for Thursday, September 24, 2015
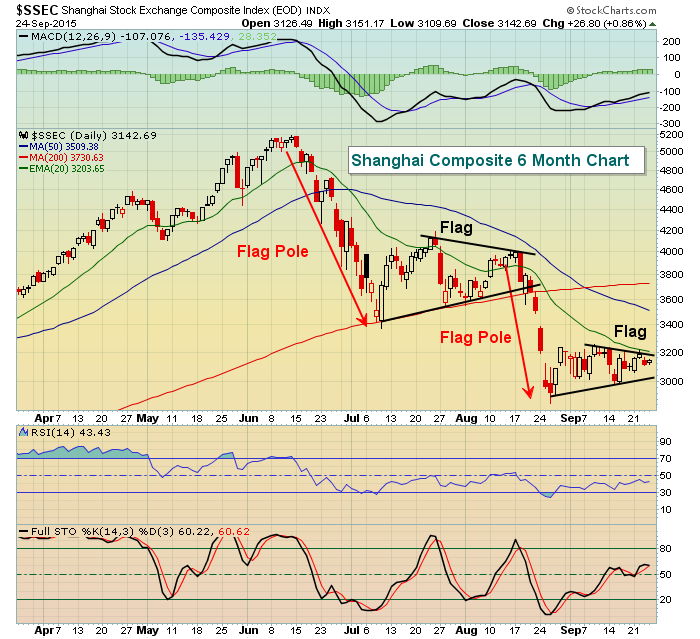
It wasn't so much about what happened during the trading session on Thursday as it was about what happened after it. U.S. equities were sharply lower in the first half of Thursday's session as the Germany drubbing continued, but we saw a reversal and solid rally into the close as traders appeared to be placing bets that perhaps Fed Chair Janet Yellen would offer up a few positives in her 5pm EST speech. She didn't change much of the rhetoric from the prior Thursday, but did clarify that she expects a rate hike sometime later in 2015. Previously, she had not indicated she was in that camp. The effect around the globe was obvious as markets worldwide were higher overnight with one exception - the Shanghai Composite ($SSEC) fell 1.6% to 3092. The SSEC remains in a bear flag with a range of 2927-3243. Here's the visual:
Utilities, energy and consumer staples led the action on Thursday with all three finishing the day in positive territory. Healthcare, financials and industrials were the laggards. Biotechs ($DJUSBT) have been rocked of late, dropping 9% in just the past week and closing yesterday at its lowest level during 2015. We're currently at a level on the DJUSBT where we should see a rally. If not, we could be looking at another 10% being shaved off. Check out the chart:
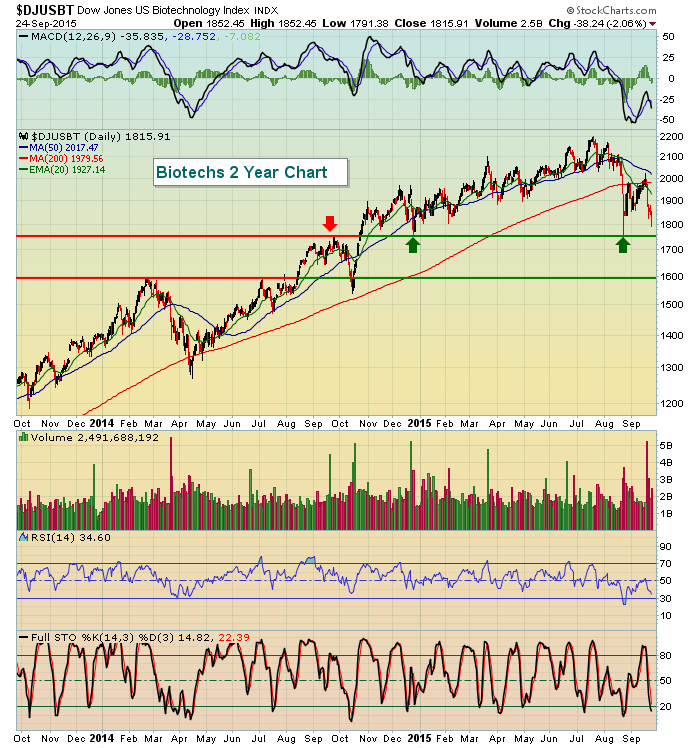
While we haven't quite reached the 1750 support area, the reward to risk on the long side has greatly improved after the recent selloff. Furthermore, the recent low has printed a positive divergence on the DJUSBT 60 minute chart. Check this out:
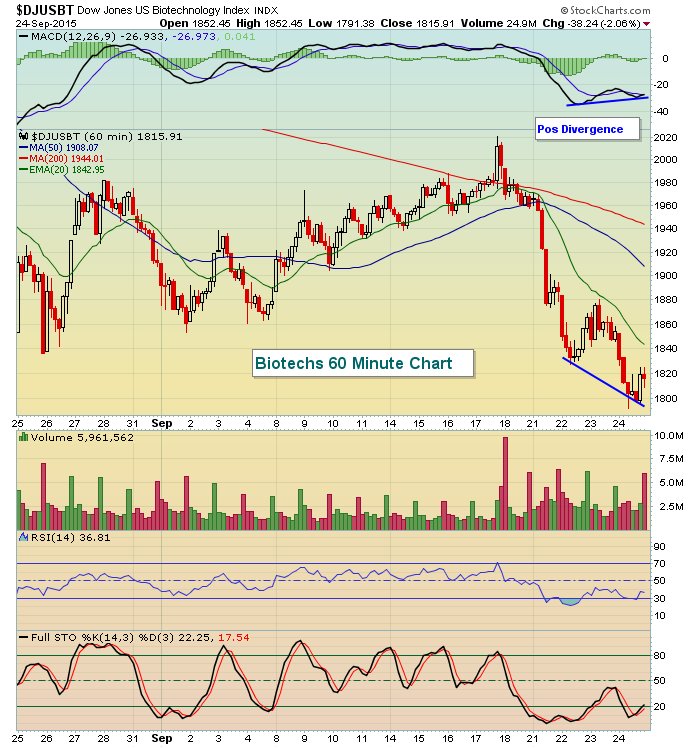
The IBB is a biotech ETF that shows very similar technical characteristics and could be used as a trading vehicle for those interested in the group. Biotechs are extremely volatilie, however, as evidenced by the 9% drop in just the last week.
Pre-Market Action
World markets are no doubt buoyed by the subtle change in policy stance by Janet Yellen and it's reflected in solid gains in Europe and across much of Asia. U.S. futures are following the ride as well with our major indices poised to open higher by more than 1%. Prior to the post-FOMC selloff, the S&P 500 struggled to clear the 1990-1995 area so that will be a very big test for the bears if this rally lasts long enough to reach that level. The dollar has strengthened off of Yellen's speech and that's likely to keep pressure on commodities during Friday's trading session. Crude oil ($WTIC) is already feeling that effect and oil is likely to remain low until we begin to see economic activity pick up in other parts of the world.
Current Outlook
Nothing really has changed in my view. I remain bullish longer-term (several months out) and bearish in the short-term (next few weeks). After several days of selling, though, it appears our downtrend has broken and this should offer up opportunities on the long side to close out September. The following is a 15 minute chart of the NASDAQ, which shows short-term technical conditions turning more bullish into the close on Thursday:
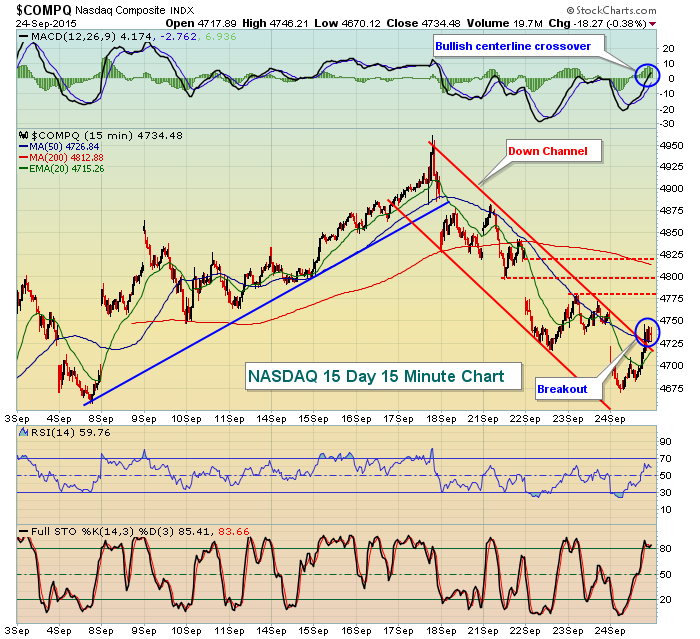
We were short-term oversold with RSI readings on this intraday chart close to 20. Any readings at or below 30 during September have resulted in at least a bounce. This time, though, the break of the down channel could lead to more short-term strength. The three red dotted lines mark areas of potential resistance. The first will be our reaction high on Wednesday, then price resistance from broken support closer to 4800, and finally at gap resistance at 4829. It's not shown here, but also keep in mind that the declining 20 day EMA on the NASDAQ currently resides at 4809. I'm looking for this rally to carry us to the 4800-4830 level, then it'll be time to reassess. None of this potential bounce changes the big picture. But the bulls do have an opportunity here in the next 2-3 days so we'll wait to see what they do with it.
Sector/Industry Watch
Well, I focused negatively on banks ($DJUSBK) and life insurance companies ($DJUSIL) after the FOMC announcement last week so I guess it's only fair to offer them both a little love this morning given the change in Fed perception. The 10 year treasury yield ($TNX) is surging after Yellen's comments last night as traders scurry out of the more defensive treasuries and move into equities. That sudden shift in bond vs. stock sentiment is very likely to be felt in both the banking and insurance areas. Let's take a look at all three on this next chart:
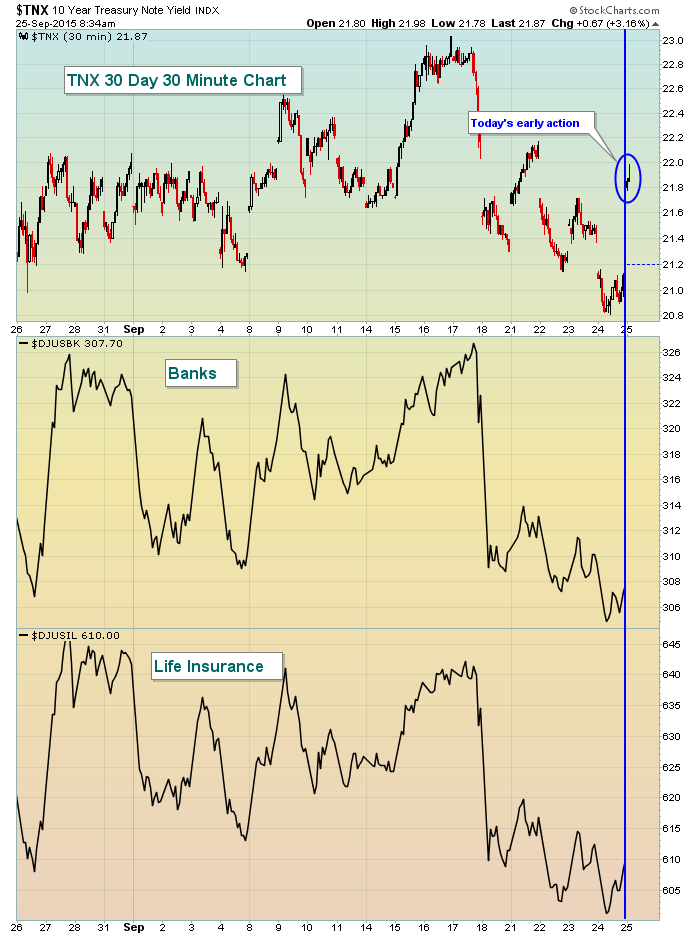
It's fairly clear from this chart that banks and life insurance companies tend to follow the 10 year treasury yield quite closely. We've seen a huge jump in treasury yields this morning. So long as an uptrend in yield continues, I'd look for a similar move higher in banks and insurance companies to develop. Like equities, we need to look for potential resistance in the TNX. 2.22% will be the first key area of yield resistance, then the biggie at 2.30%. We'll take it one step at a time here.
Historical Tendencies
The past week's bearish historical tendencies have been well documented. If you need a review, you can refer to any of the previous 5-6 blog articles for details.
The next couple weeks are very strange from a historical perspective. None of our major indices performs too well into the end of the month. That's unusual because the 28th through the 31st tend to produce very positive market action during most months. September is an exception. The Russell 2000 tends to close out September on the strongest note. The early October action is the most confusing, however, as both the S&P 500 and NASDAQ show historical bullishness during the first week while the more aggressive Russell 2000 shows negative annualized returns - a few VERY negative - for eight of the first nine days of the month. So while we could see a short-term bounce in the Russell 2000 based on history, if you're looking for a nice advance into earnings season, I'd consider it with the S&P 500 or NASDAQ as opposed to the Russell 2000.
Key Earnings Reports
BBRY: -$.13 (actual) vs. -$.07 (estimate)
Key Economic Reports
Final Q2 GDP released at 8:30am EST: +3.9% (actual) vs. +3.7% (estimate)
September PMI services to be released at 9:45am EST: 55.5 (estimate)
September consumer sentiment to be released at 10:00am EST: 87.1 (estimate)
I want to wish everyone a wonderful and relaxing weekend.
Happy trading!
Tom


