Market Recap for Tuesday, September 15, 2015
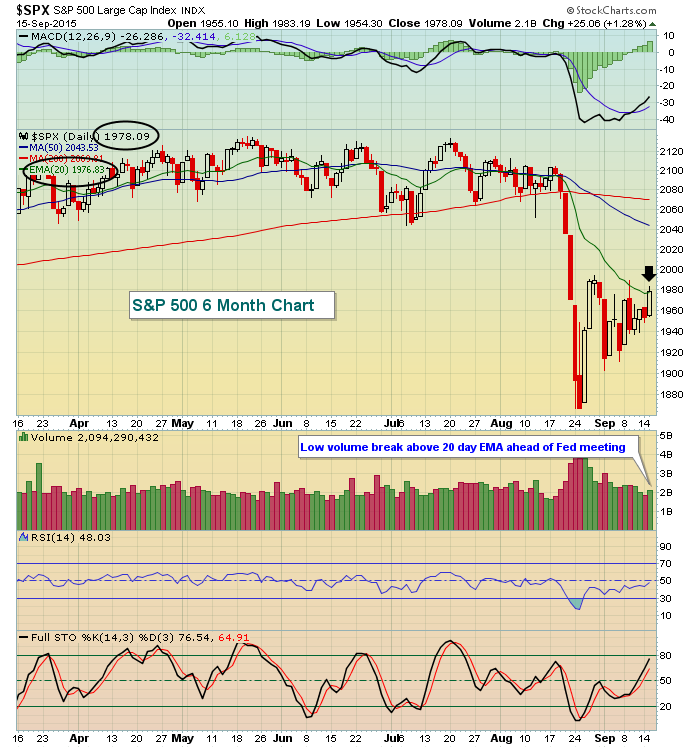
Fairly light volume continued on Tuesday, but the bulls were in charge throughout the day with the Dow Jones, S&P 500 and Russell 2000 all joining the NASDAQ back above falling 20 day EMAs. At least that part of the damaged technical picture has been restored. There's still much work to do as traders await the Fed's next move, which Fed Chair Yellen will announce on Thursday at 2pm EST. Much speculation abounds, but as technicians we don't really care about the news. Instead, we care about the price action. Below you can see the S&P 500 climb back above its 20 day EMA:
Now that we've cleared the 20 day EMA across our major indices, next up will be reaction highs in late August after the heavy volume selling a week earlier. In the case of the S&P 500, the level to watch is 1989. A break above on a closing basis sets up the market for a further advance technically, perhaps as high as 2045 to test the breakdown beneath the early July low.
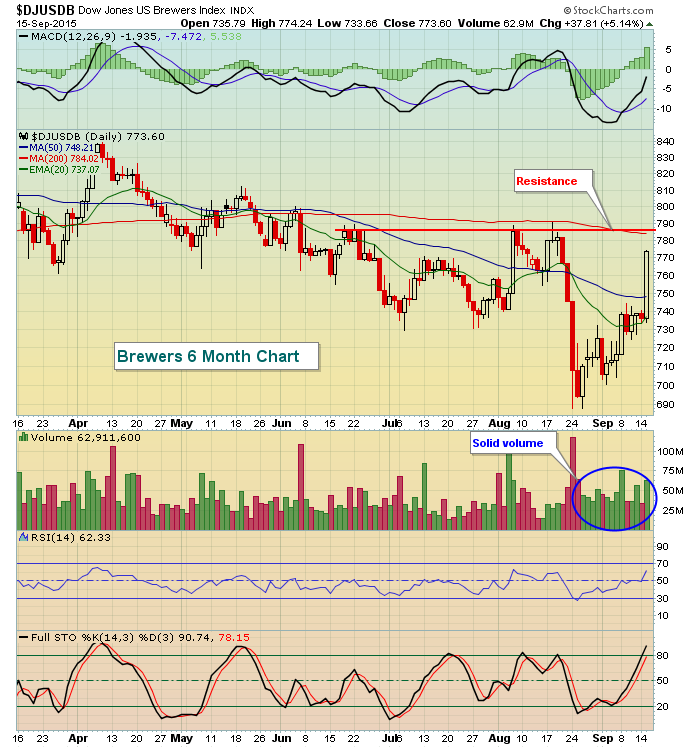
All nine sectors traded higher on Tuesday with notable strength from industrials and financials. Brewers ($DJUSDB) was the best performing industry group and it's now risen more than 10% off the August lows as a triple top nears. Take a look:
Pre-Market Action
There's been some volatility this morning, but U.S. futures are near the flat line as a new trading day approaches. The mindset hasn't really changed. We're still awaiting the Fed, although traders did not sit on their hands yesterday. They were buying stocks - stocks that should perform well in a strengthening economic environment. So perhaps a bet is being made that the Fed will stick to its plan of raising rates by 25 basis points and that they continue to believe we'll see a better economy ahead. As I mentioned above, however, the bulls have more work to do - especially with regard to price resistance.
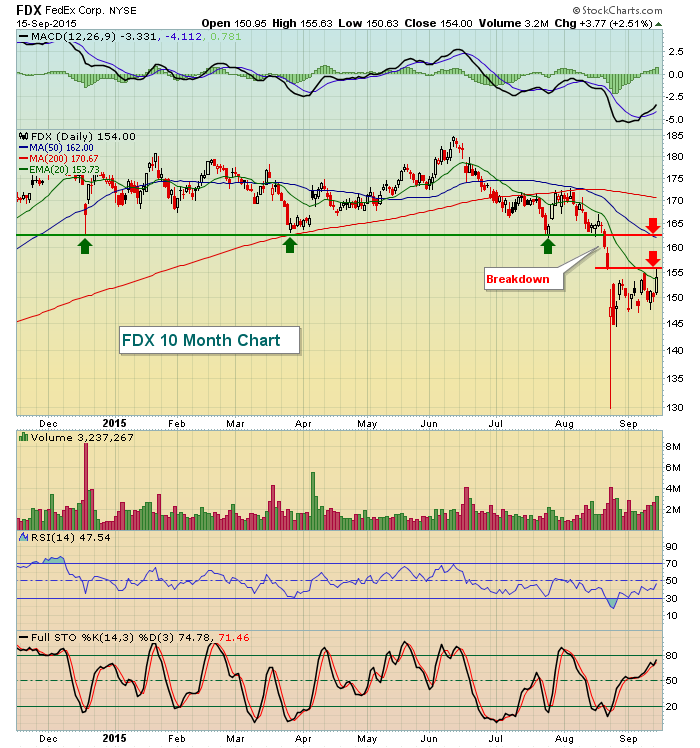
FedEx (FDX) reported earnings this morning and came up a bit short. FDX is relatively unchanged thus far but will likely trade with volume today. Technically, the stock is near both gap resistance and its falling 20 day EMA as illustrated below:
Current Outlook
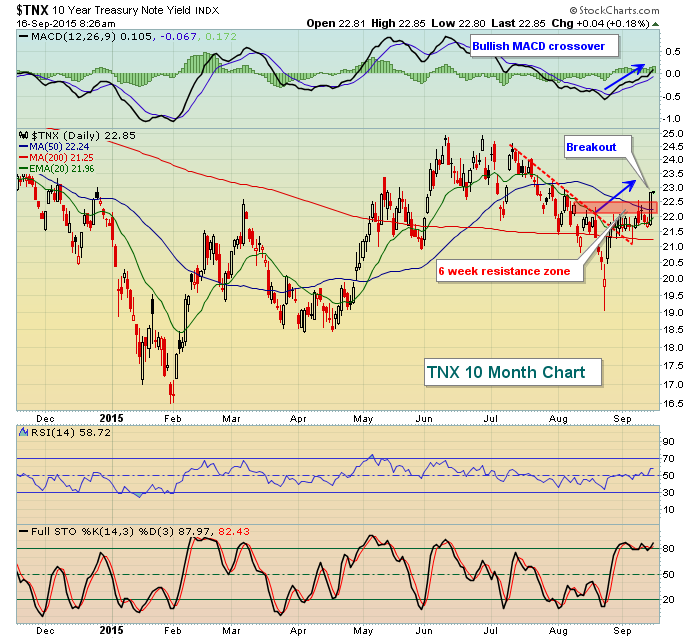
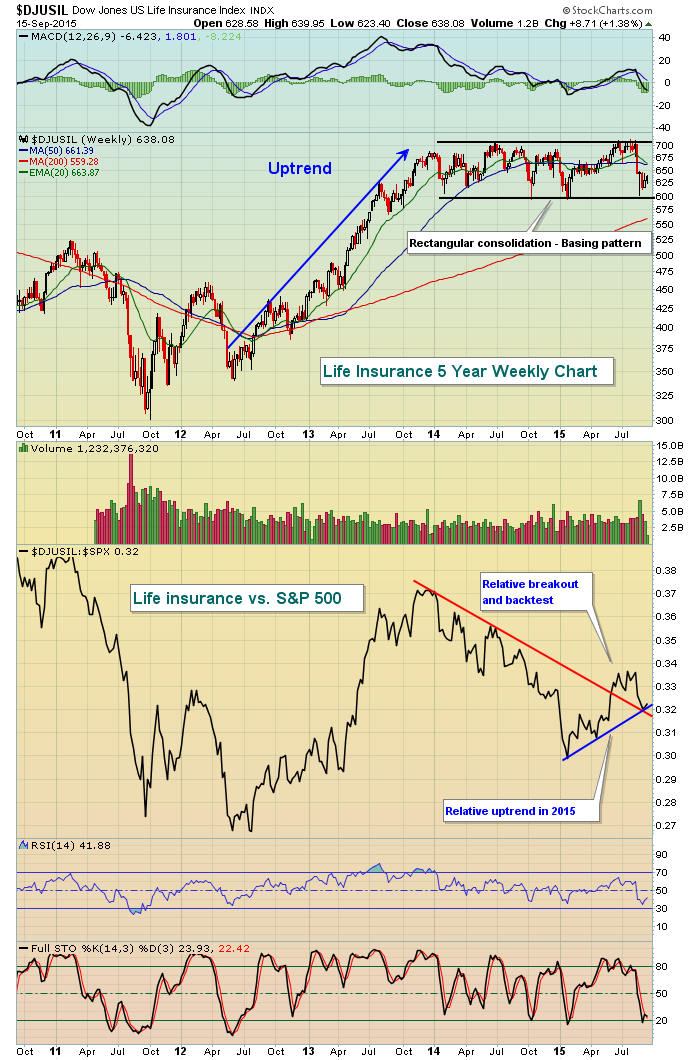
One thing changed on Tuesday. The 10 year treasury yield ($TNX) finally broke out above the 2.20%-2.25% short-term resistance area. The selling of treasuries (and corresponding rise in the yield) ahead of the Fed meeting appears to be a bet in the bond market that the Fed will stick to their guns and raise tomorrow afternoon. This breakout (shown below) should also be viewed as a positive for financials and, more specifically, banks and life insurance companies, both of which generally perform well as yields rise. They both performed very well on Tuesday and I'd expect that to continue so long as the TNX remains above the 2.20%-2.25% support level now. Here's the TNX:
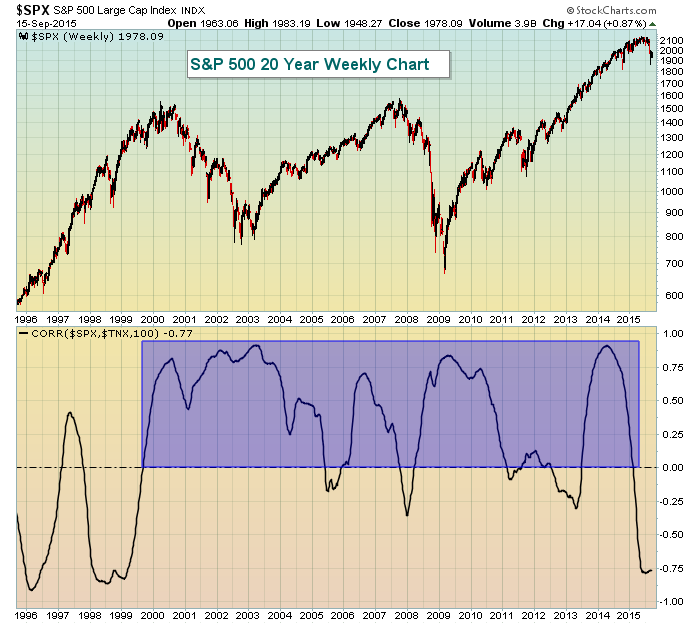
If this breakout in treasury yields is sustained, it is definitely a bullish development for equities in my opinion. Over long periods of time, there's been a fairly strong positive correlation between the direction of treasury yields and the S&P 500. I've illustrated this relationship by using the "correlation " indicator and stretching out the parameters from the default of 20 periods to 100 in order to smooth the results. With few exceptions, the positive correlation has been in play since the turn of the century as the correlation (SPX vs. TNX) has remained mostly in positive territory (blue shaded area). Check it out:
Sector/Industry Watch
Banks and life insurance companies typically benefit from higher treasury yields so if the breakout in the TNX is sustained, it only makes sense to consider owning ETFs or stocks within this space. I'll make the bullish argument for life insurance companies on the chart below:
Historical Tendencies
Because of its significance, I'll continue to reprint the following for the next week or so. Here are the annualized returns on the NASDAQ by calendar day next week:
September 21 (Monday): -92.11%
September 22 (Tuesday): -83.40%
September 23 (Wednesday): -41.45%
September 24 (Thursday): -18.48%
September 25 (Friday): -53.51%
Key Earnings Reports
FDX: $2.42 (actual) vs. $2.44 (estimate)
ORCL: $0.48 (estimate) - reports after the close today
Key Economic Reports
FOMC meeting begins and culminates Thursday at 2pm EST with announcement
August CPI released at 8:30am EST: -0.1% (actual) vs. 0.0% (estimate)
August Core CPI released at 8:30am EST: +0.2% (actual) vs. +0.1% (estimate)
September housing market index to be released at 10am EST: 61 (estimate)
Happy trading!
Tom

