Market Recap for Monday, September 14, 2015
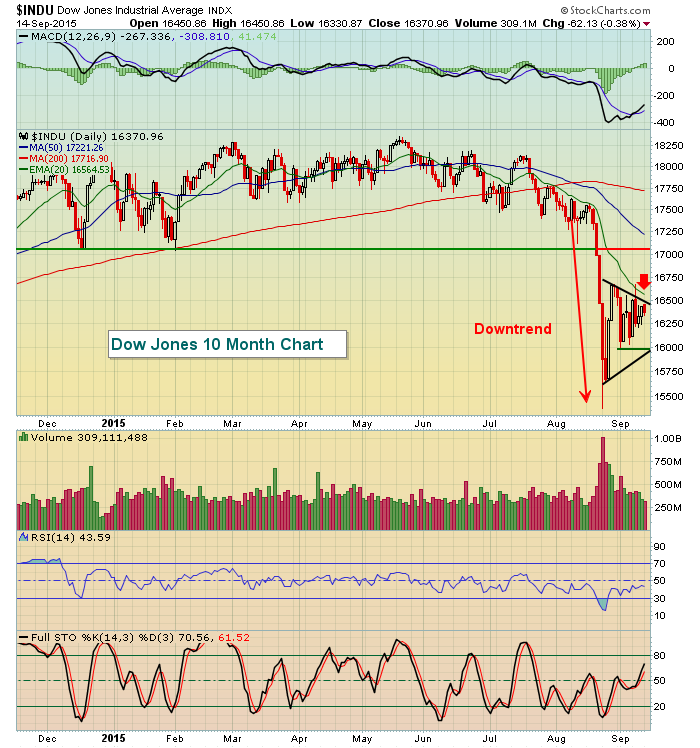
It's hard to take too much away from Monday's action. Volume was extremely light with the NASDAQ volume at 1.45 billion shares. It was one of the lightest volume days of the year and the lightest since June 12th when the NASDAQ saw 1.42 billion shares change hands. The Dow Jones ($DJI) continues to trade within a symmetrical triangle and I'd expect this range to hold until we hear from the Federal Reserve on Thursday at 2pm EST. This triangle is squeezing so it'll be interesting to see if the breakout or breakdown occurs with the Fed decision on Thursday. Have a look at the Dow:
The trading range on Monday was not nearly as wide as we've been accustomed to of late. In fact, the Dow Jones has traded within slightly more than a 1% range over the past 3 trading sessions combined. But again, that fits with the symmetrical triangle pattern where highs move lower and lows move higher. The problem for the bulls is that these types of continuation patterns generally follow the path of the prior trend. As you can see from the above chart, that prior trend was down. The odds are we'll see another leg lower, possibly retesting recent low prices on our major indices. To negate this likelihood, watch for technical breakouts to void the current patterns. It's up to the Fed and traders' reaction to their announcement.
Pre-Market Action
Current Outlook
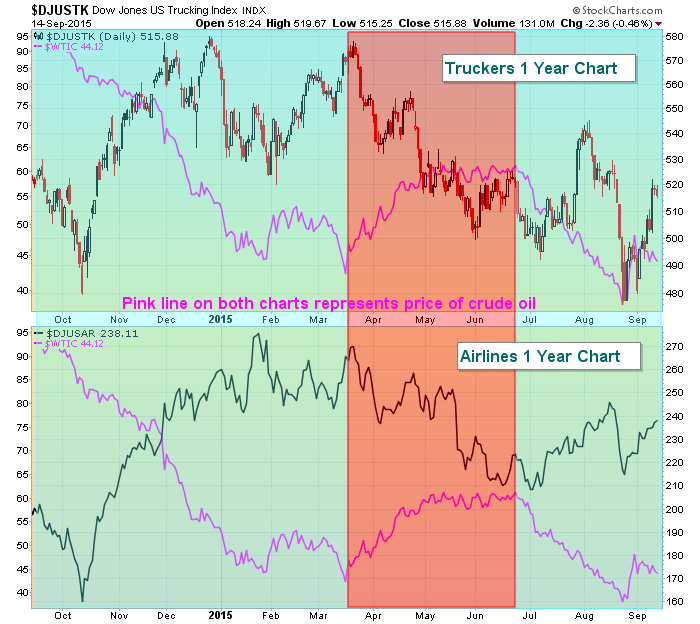
Not much has changed in the past couple weeks. The recovery has been nice, but it's been rejected at key technical resistance levels along the way. The good news is that a couple key aggressive areas of the market like consumer discretionary and transports have held up well. Over the past week and month, airlines and truckers share the top two spots among industrials in terms of performance. Lower crude oil prices ($WTIC) have provided tailwinds for many transportation stocks, but relative strength in transports vs. utilities may have more to do with the anticipation of a strengthening economy throughout the balance of 2015 and into 2016. That's why hearing from the Fed will be so interesting on Thursday. Is the U.S. economy showing enough signs of economic strength to trigger the Fed's first interest rate hike in nine years?
Below illustrates the impact of crude oil on both airlines and truckers:
The blue shaded area reflects solid performance by both truckers and airlines as crude oil prices tumble. The red shaded arrow, by contrast, illustrates quite well what happens to many transportation stocks as crude oil prices rise.
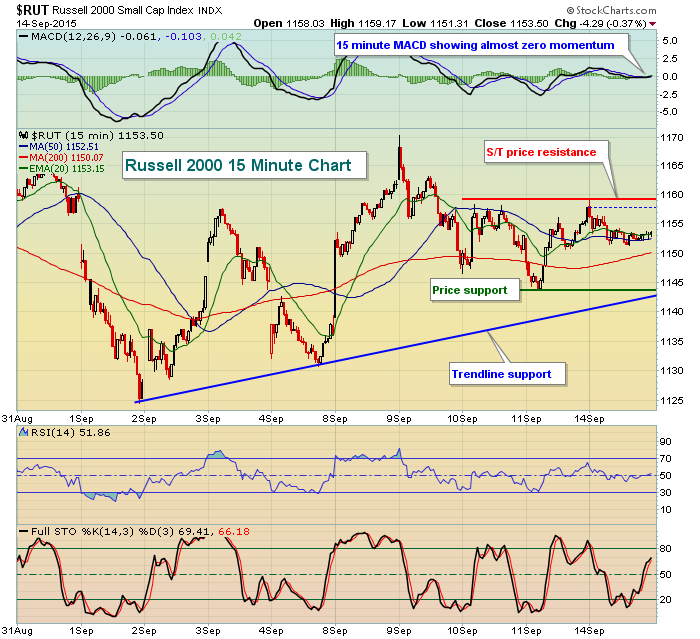
From an intraday perspective, we can look at the Russell 2000 ($RUT), although little can be gained by viewing the near-term intraday charts as the volatile action from the recent past has dried up as we await the Fed. Still, here's a look at a couple key levels to watch for on this small cap index:
Trendline support and price support are at roughly 1143 and 1144, respectively, while price resistance hovers just below 1160. I would guess that the RUT will trade in this range until we hear from the Fed. One other resistance level to keep in mind is the 20 day EMA (not shown on this 15 minute chart), which currently resides at 1162.
Sector/Industry Watch
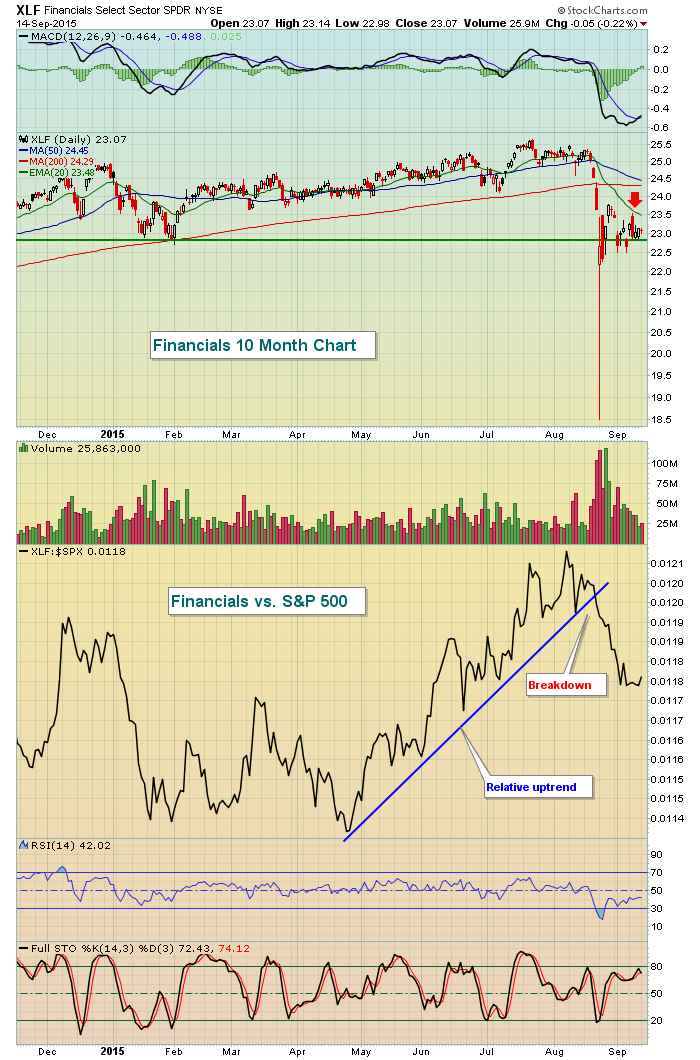
Financials have lagged the S&P 500 badly over the past month. However, a relative uptrend preceded the sudden weakness and the June relative low has not been lost. As a result, this aggressive area of the market could be poised to lead if the bulls can stage a breakout above key technical resistance, most notably the falling 20 day EMA. Check out the steep fall in financials and the recent relative performance:
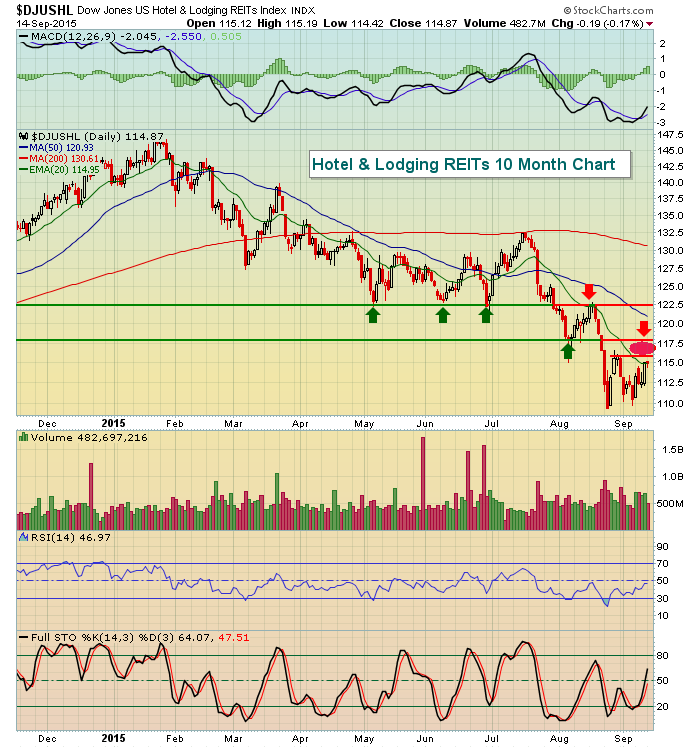
On Monday, financials were one of the best performing sectors, but much of the strength came from REITs that are enjoying oversold bounces. Over the past week, the hotel and lodging REIT ($DJUSHL) has surged 4% to lead all financial industry groups, but it is now having to deal with overhead resistance similar to the XLF. Take a look:
Historical Tendencies
This week is hit or miss on the NASDAQ as September 15th and 17th both show weak historical results while September 16th and 18th show much better results. Let's call it a wash. But next week is a completely different story as the NASDAQ shows the annualized returns for each day as follows:
September 21 (Monday): -92.11%
September 22 (Tuesday): -83.40%
September 23 (Wednesday): -41.45%
September 24 (Thursday): -18.48%
September 25 (Friday): -53.51%
Key Earnings Reports
UNFI: $0.72 (estimate)
Key Economic Reports
August retail sales released at 8:30am EST: (actual) vs. +0.3% (estimate)
August retail sales excluding autos released at 8:30am EST: (actual) vs. +0.2% (estimate)
September empire state manufacturing survey released at 8:30am EST: (actual) vs. -0.50 (estimate)
August industrial production to be released at 9:15am EST: -0.2% (estimate)
August capacity utilization to be released at 9:15am EST: 77.8% (estimate)
July business inventories to be released at 10:00am EST: +0.1% (estimate)
Happy trading!
Tom

