Market Recap for Monday, September 21, 2015
Impulsive selling has been the signature of the past month. Beginning with the August free fall, when the selling has hit, it's hit in a hurry. Monday was a perfect example of why we are not out of the woods just yet. In the morning, it appeared as if we might clear an important short-term hurdle - the reaction high from Friday's selling. But it didn't happen. Take a look at this intraday chart of the S&P 500:
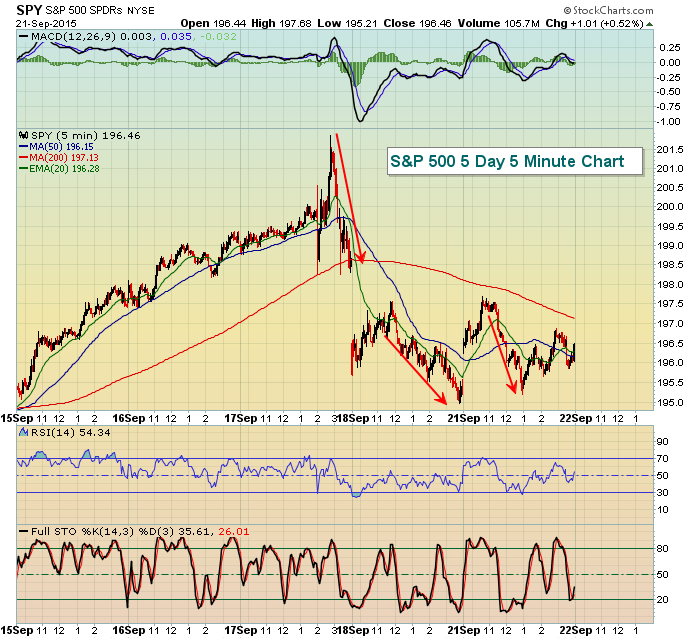
When our major indices move higher, we tend to stair step higher. But on the selling, MOVE out of the way! The intraday high on Monday challenged the reaction high on Friday briefly, then the sellers took over completely with a 1% drop over the next 90 minutes. On the daily chart, this action followed the expected technical path perfectly. Our rally off the August lows formed a bearish wedge. Friday's gap down and selling broke that wedge support and the early morning strength on Monday backtested the breakdown before more selling kicked in. The above chart showed you the intraday action, now check out the S&P 500 daily chart:
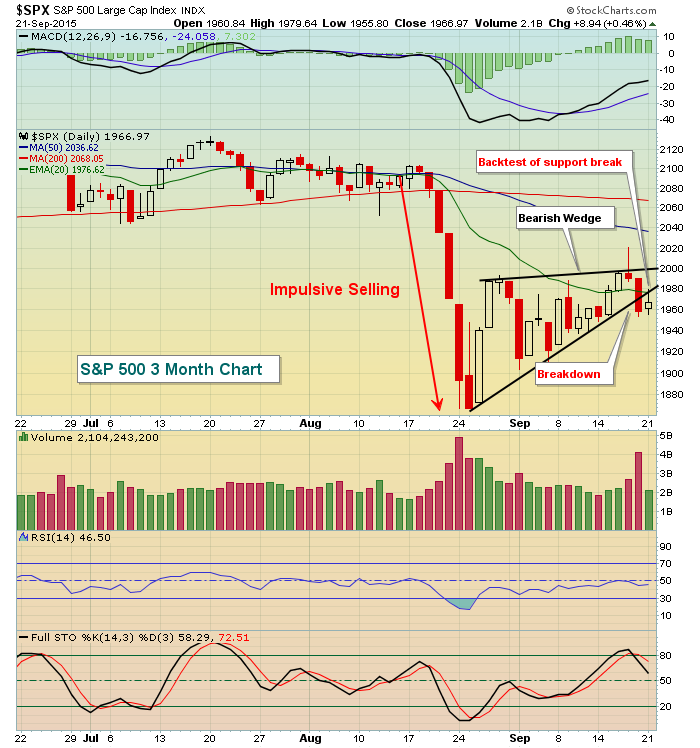
Breakdowns out of these bearish wedge patterns typically represent the continuation of the prior trend, which clearly is lower.
Pre-Market Action
If the action in Europe this morning is any indication, that prior trend continuation is set to begin at the very open this morning. At last check, U.S. futures were very sharply lower and we'll see the NASDAQ potentially challenging its 4750 support at the opening bell. Take a look at the NASDAQ's issues:
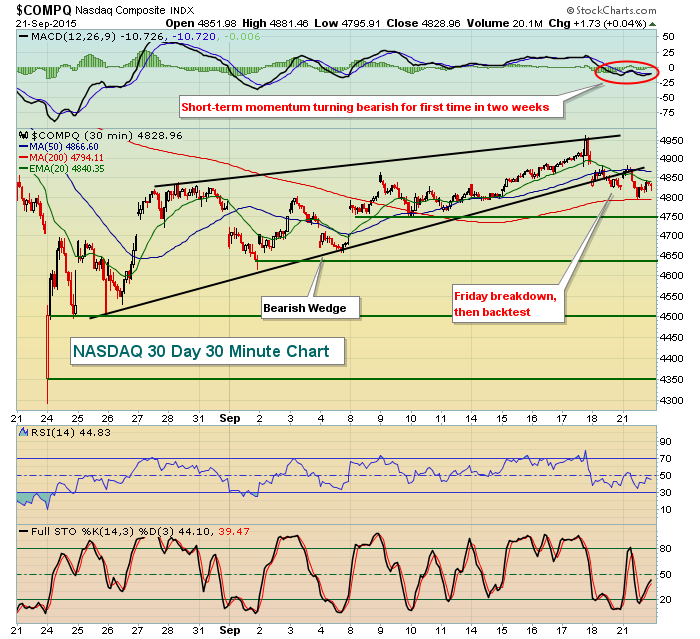
The MACD moving back beneath centerline support is a big deal as the bigger picture suggests we'll head lower. Therefore, this momentum shift is indicating that the next leg lower is likely here. Batten down the hatches. The horizontal green lines on the chart mark price support levels where we could see buyers stepping in to stem the tide of selling. Despite the September recovery, the Volatility Index ($VIX) still closed above 20 on Monday and is likely going to spike significantly today. Any time the volatility remains elevated, you need to be on high alert for swooping downside action.
At last check, the German DAX was down nearly 3% on today's session and the S&P 500 typically mirrors the DAX performance. That too should be setting off alarms in the minds of traders as we open up this Tuesday session.
Current Outlook
Well, I think I've probably already summed up how I feel about the market right now. I'd be extremely cautious on the long side (smaller positions, higher cash levels, covered calls, etc) while being more aggressive on the short side if that's your preferred position. I am maintaining my longer-term bullish stance, but most definitely I'm short-term bearish. We still have to work our way through the remaining part of September and things can turn very ugly this time of the year as we already know. In addition to September being a historically weak month, it's the season for earnings warnings, which will only add to the downdraft.
One very significant positive underneath the surface of all of this weakness is that the discretionary side of consumer stocks continues to perform extremely well on a relative basis. If we were heading into a deep recession and an extended bear market, consumer discretionary stocks would be among the first to fall. But that is not happening. In fact, take a look at how well this group has performed against their staples counterparts:
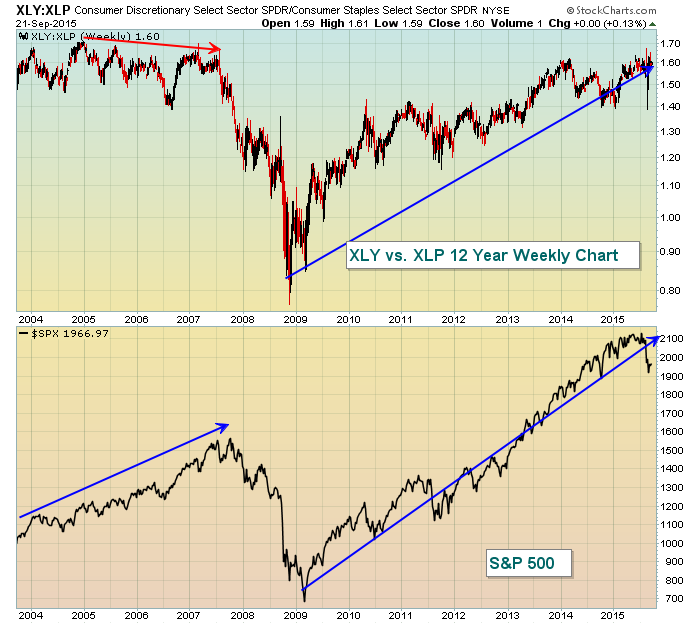
As you can see, the XLY:XLP ratio was deteriorating PRIOR to the 2007-2009 bear market as traders positioned themselves away from this more aggressive area of consumer stocks. That hasn't been the case thus far in 2015. I'll be watching to see if it changes.
Sector/Industry Watch
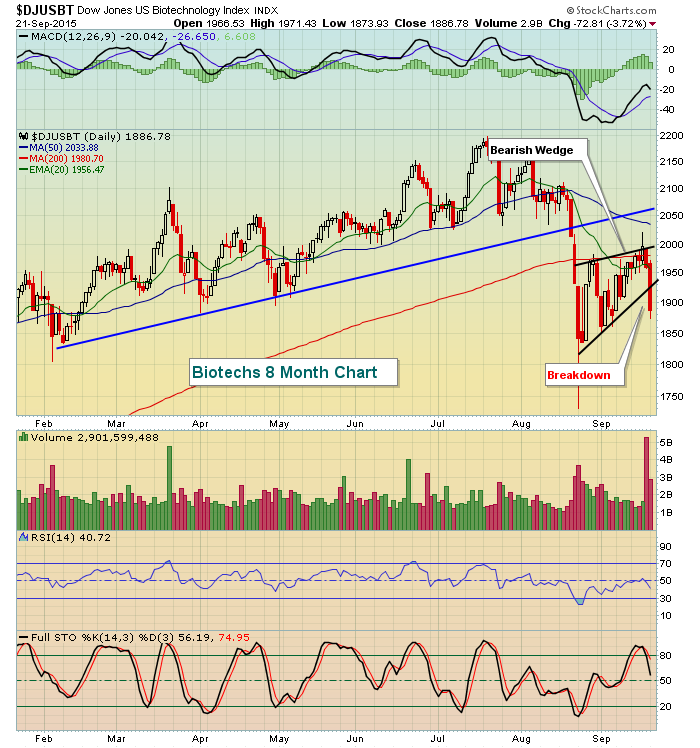
Healthcare (XLV) was the worst performing sector yesterday and has also been the worst performing sector over the past week. In addition, it ranks as one of the worst performing sectors over the past month and three month periods. Long-term negative divergences had printed on the weekly charts on every industry group within healthcare back during the Spring and that was a signal of slowing upside momentum. Those signals came on the heels of multi-year outperformance by this space so it certainly made sense for them to take a break. They are definitely taking a break now. On Monday, biotechs ($DJUSBT) were the worst performing industry group as they broke their bearish wedge support, opening the door up to lower prices in the days ahead. I'd expect today to be another rough day for the biotech stocks. Here's the chart:
Historical Tendencies
As a reminder, here are the annualized returns on the NASDAQ since 1971 for each of the following days this week:
September 21 (yesterday): -92.11%
September 22 (today): -83.40%
September 23 (Wednesday): -41.45%
September 24 (Thursday): -18.48%
September 25 (Friday): -53.51%
As you can see, there's not a lot to look forward to this week from a historical perspective. It is going to be difficult to overcome these tendencies given the weak technical state of the U.S. market right now.
Key Earnings Reports
AZO: $12.75 (actual) vs. $12.67 (estimate)
CAG: $.45 (actual) vs. $.39 (estimate)
CCL: ?? (actual) vs. $1.63 (estimate) - scheduled to report this morning, nothing at last check
DRI: $.68 (actual) vs. $.58 (estimate)
FDS: $1.48 (actual) vs. $1.48 (estimate)
GIS: $.79 (actual) vs. $.69 (estimate)
KMX: $.79 (actual) vs. $.75 (estimate)
Of the above, AZO, DRI and FDS also beat revenue estimates.
Key Economic Reports
July FHFA House Price index to be released at 9:00am EST: +0.4% (estimate)
Happy trading!
Tom


