Market Recap for Friday, September 11, 2015
Utilities and consumer stocks led the market rally on Friday. All sectors finished fractionally higher, except energy and materials. Their weak performance has been the number one factor for the weakness we've seen in our major indices in 2015. Year-to-date, energy (XLE) is down 18.87%. Materials (XLB) have not been a whole lot better, falling 11.15%. Consumer discretionary (XLY) and healthcare (XLV), meanwhile, are up 5.36% and 3.94%, respectively.
The best performing industry group from Friday was gold mining ($DJUSPM), rising 3.2%. From the chart below, I have to wonder how long this strength will last:
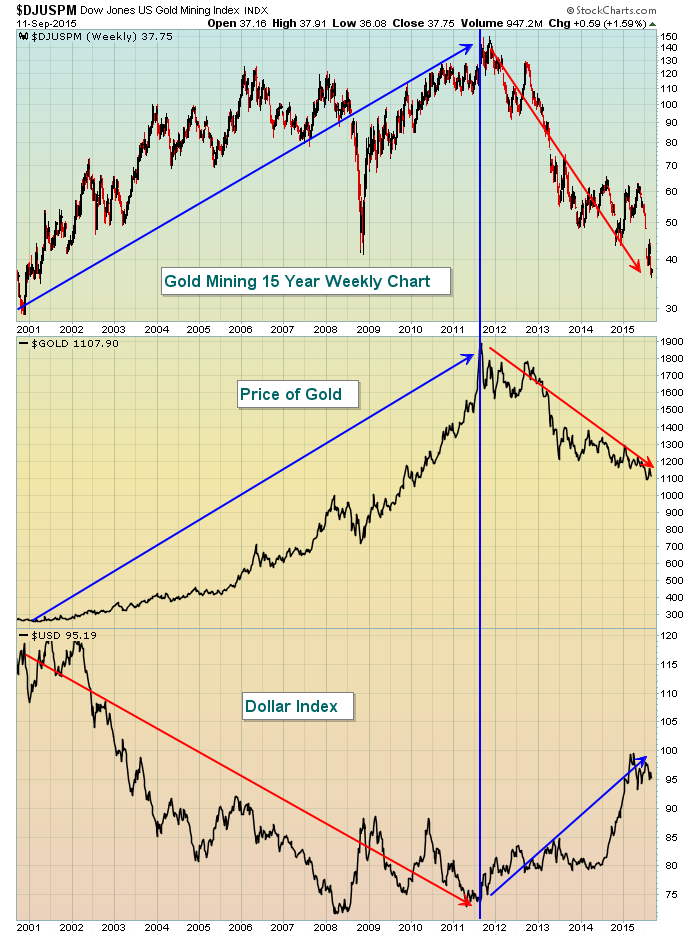
Gold mining is likely seeing an oversold bounce. The dollar has also been pausing after a nine month parabolic rise that carried the greenback to a 12 year high. Rising U.S. interest rates are likely to continue to add strength to the dollar although technically a trip down to perhaps 90.00-92.00 to test the breakout above previous 2004, 2005, 2008, 2009 and 2010 highs cannot be ruled out. Ultimately I do see a higher dollar, higher treasury yields, and lower gold prices. Therefore, I'd steer clear of anything gold-related for the foreseeable future. Gold outperformed the S&P 500 for more than a decade. Over the past few years, the S&P 500 has turned the table and I expect that to continue. Just my opinion.
Pre-Market Action
As traders await the Fed announcement on Thursday at 2pm EST, I would expect the market to continue to settle down. The volatility index ($VIX) has remained high, though it did close on Friday at 23.20, its lowest close since August 20th when it finished that day at 19.14. We might even see that level approached this week as volume is likely to subside ahead of the two day FOMC meeting that begins Wednesday morning.
Asian markets were mostly lower overnight. U.S. futures have been bouncing back and forth, just recently dipping into negative territory. That shadows the action in Europe where European markets were mostly positive until recent weakness carried many of those indices into negative territory.
There hasn't been much economic news here in the U.S. and traders will likely be cautious ahead of the FOMC's two day meeting that begins on Wednesday and culminates with the widely anticipated Fed announcement on Thursday at 2pm EST. Will they raise rates for the first time in years? What does the stock market want to see? While it's hard to tell, my guess is that traders have now built in the likelihood of an increase. If there is no increase, that could be interpreted as the Fed's lack of confidence in our economic recovery. Given the higher levels of volatility and fear, that would not be received well in my opinion.
Current Outlook
The bulls are at least showing resiliency. There's a long, long way to go technically, but one small technical obstacle was cleared on Friday. The NASDAQ became the first of our major indices to climb back and CLOSE above its 20 day EMA. It's not much, but it's a start to repair the technical damage inflicted over the past several weeks. While the market's last 5 minute surge on Friday emboldened the bulls, we do still remain right in the middle of serious short-term resistance in the form of price, moving average and gap. Here's the reminder:
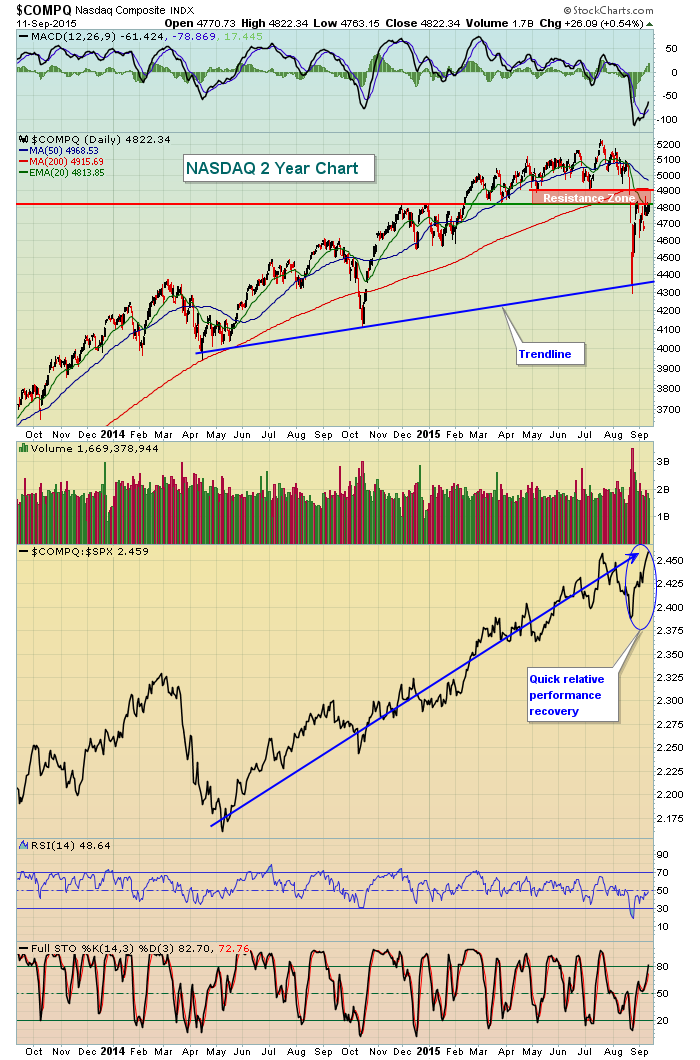
The good news is that the longer-term uptrend remains intact. The October 2014 low represents key resistance and that has held thus far. Also note how quickly money has rotated back to the NASDAQ on a relative basis (vs. the S&P 500). The NASDAQ is viewed as the riskier index so it's always good to see strong rotation towards those stocks. Overhead resistance cannot be overstated, however, as volume was extremely heavy when that support area was lost. Therefore, we cannot just assume we'll move back through it. 4800-4900 will see lots of sellers although the potential catalyst to see a breakout is the Fed meeting this week. The Fed has had the collective backs of the bulls throughout this 6 1/2 year bull market and one of their mandates - whether they say it or not - is to keep consumer confidence high. Part of that requires a stable stock market.
To compare the above NASDAQ relative performance to its relative performance at the start of our last bear market, check out this 2007 chart:
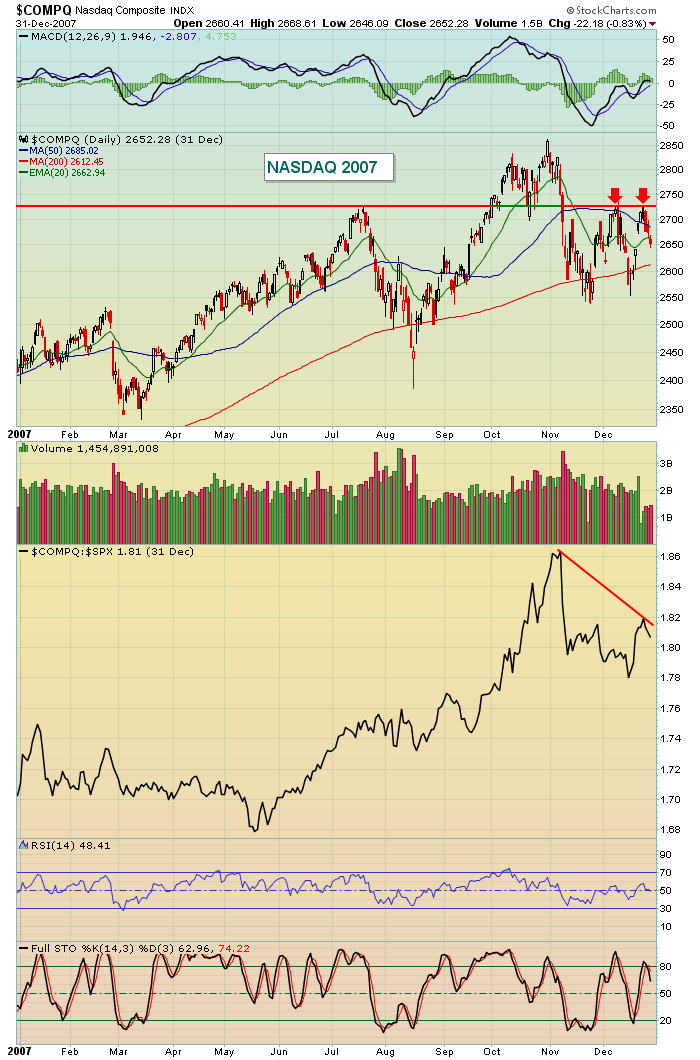
In 2007 we made initial runs to test price resistance just as we're doing now, but notice the difference in the NASDAQ's relative strength? Currently, the NASDAQ has broken to a fresh relative high while in 2007 we did not see money rotate back towards NASDAQ stocks in the same relative manner. The red line above shows relative deterioration (as I'd expect) in the NASDAQ during the initial phase of the bear market. So why are we now seeing a relative breakout in the NASDAQ with short-term technical breakdowns everywhere? While this doesn't prove the bull market will resume, it definitely gives us a little different feel of traders' mindsets now vs. 2007. After all, if we were entering a bear market, would you want to own the higher risk and higher PE stocks on the NASDAQ?
Sector/Industry Watch
One month ago today, the S&P 500 closed at 2091.54. We closed on Friday at 1961.05. That's a 6.24% decline. Among all of the industry groups in our four aggressive sectors (technology, industrials, financials and consumer discretionary), there is only one industry group that has moved higher - home construction ($DJUSHB) in the consumer discretionary space. It's risen ever-so-slightly, but in this market environment it's been very impressive. Take a look at a visual:
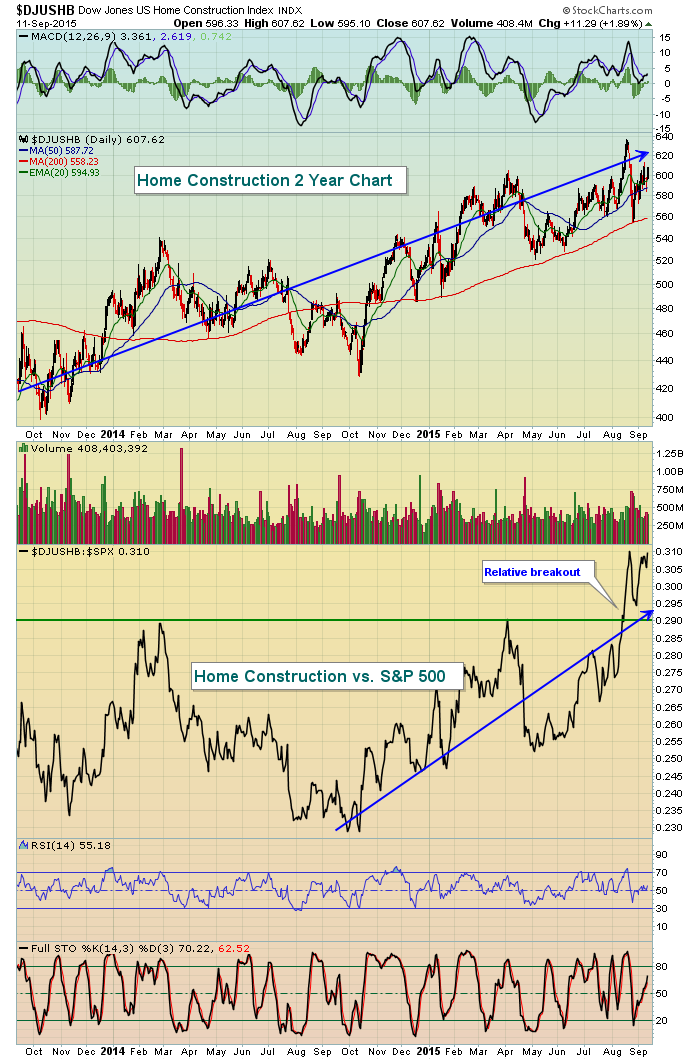
Perhaps what's most impressive is that home construction is an interest rate sensitive group. The Fed has been discussing the likelihood of rate hikes - although the pace of any hikes will be very slow. Still, a relative breakout in an interest sensitive group a couple days before the first U.S. rate hike in MANY years.
Historical Tendencies
I'll be providing historical data later in the week, but please realize that we are on the verge of entering the 3rd worst historical period of the year on the S&P 500 dating back to 1950. From a seasonality perspective, the odds will be with the bears during much of the second half of September.
Key Earnings Reports
None
Key Economic Reports
None
Happy trading!
Tom


