Market Recap for Friday, September 4, 2015
Volatility remains the key for traders. A Volatility Index (VIX) in the 20s and 30s suggests that we not only could wake up to anything, but that we also should expect to see wild swings both higher and lower during the trading day. The market anticipates this kind of volatility by placing higher premiums on options, making them much more expensive. After the big spike above 50 recently, it's normal to see volatility subside. But the question is will it continue to subside or is the next bout just around the corner? In the past when the VIX remains elevated after short-term breakdowns, the weakness generally continues although periods of strength should be expected as well. We just need to continue to focus on the key resistance levels and the wide trading ranges. As a reminder, here are the levels I continue to watch on the S&P 500 ($SPX):
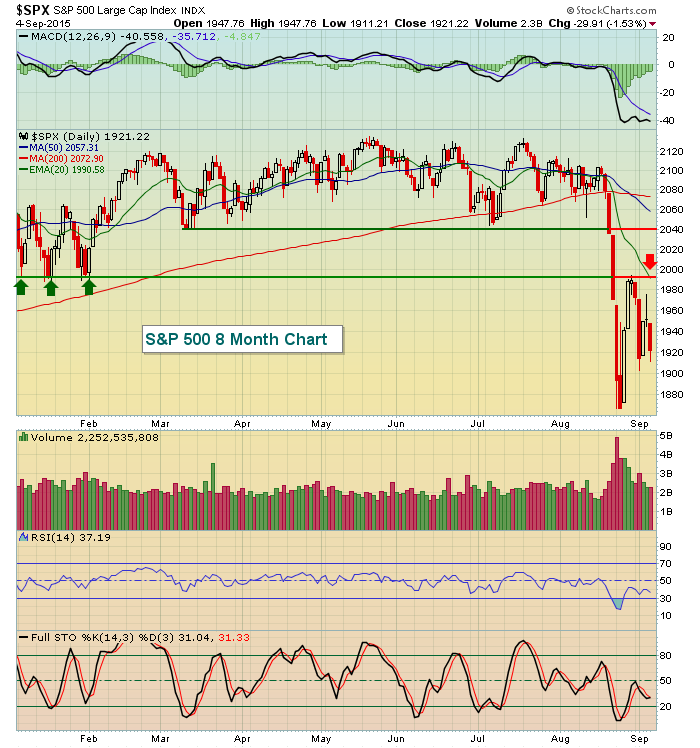
You can't really see it from the S&P 500 chart (or the Dow Jones chart) because they fail to show the extreme gaps from the past couple weeks. However, if you look at the SPY or DIA or the NASDAQ on a candlestick chart, you'll see gaps all over the place. The trend remains lower and in the short-term that's the trend I'd consider following, but you need to be aware of the potential for BIG gaps in BOTH directions as volatility is a primary driver for now.
August employment numbers were released on Friday and already weak futures turned further negative as the headline jobs number came in 50,000 short of expectations. July was revised higher to offset the August shortfall somewhat, but perhaps the worst part was the hourly earnings growth of 0.3%, which came in stronger than the 0.2% expected. Also, the unemployment rate fell from 5.3% to 5.1% and that likely did little to sway the Federal Reserve from a rate hike later this month. The 10 year treasury yield ($TNX) meanwhile was unable to clear its 2.20% resistance level.
All sectors finished lower on Friday in a broad selloff that left every group well beneath key 20 day EMA resistance levels. That gives the bulls some room to work and that's reflected in this morning's futures.
Pre-Market Action
U.S. equities appear poised for a solid opening on the heels of a three day holiday weekend. Asian markets and European markets are higher, though Japan's Nikkei Index did fall over trade concerns. China's Shanghai Composite, however, was up more than 3% despite economic reports that show the world's second largest economy to be shrinking. Here in the U.S., there is little economic news of importance today. In fact, there's not going to be much U.S. economic news all week. We will see the weekly jobless claims number on Thursday and a peak at inflation at the producer level on Friday. Otherwise, it'll be fairly quiet from both an economic and earnings perspective. That leaves us to trade off of global markets and news and technicals. It's that latter issue that has me worried, however, as we have breakdowns everywhere with little repair thus far. At last check, futures suggest we could open perhaps 1.5% higher. Of course, we also know how rapidly the numbers can change - even in the pre-market!
Current Outlook
Should we see an open somewhere in that 1%-2% range, we'll still open beneath declining 20 day EMAs on all of our major indices. One sector that I'll be watching closely will be consumer discretionary (XLY). Throughout the recent turmoil, we've seen many solid earnings beats in this space and the XLY has continued to perform extremely well on a relative basis to its consumer counterparts - staples. That's an indication that traders remain aggressive and that's also the bulls' best hopes for a quick recovery, similar to the sudden reversal we saw last October. First, check out the XLY chart:
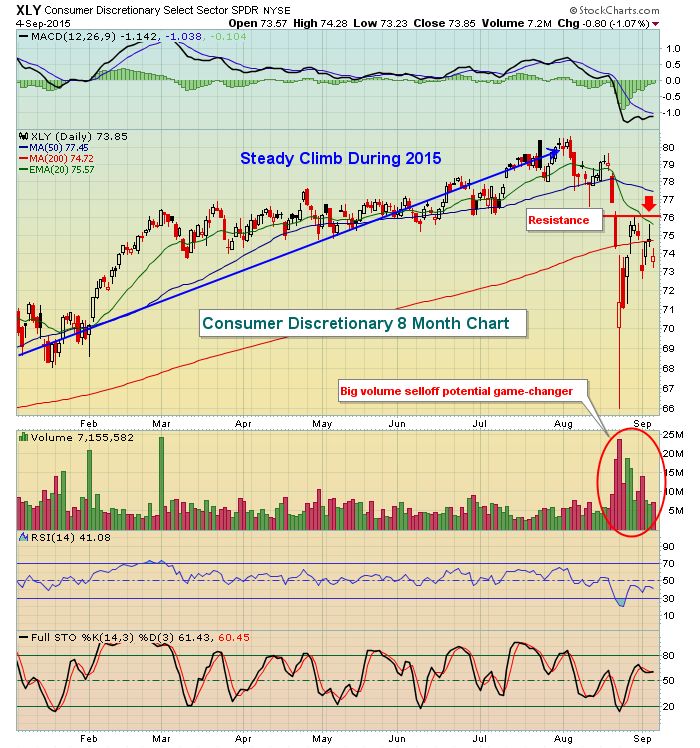
Best Buy (BBY), Abercrombie & Fitch (ANF), Guess Inc (GES), PVH Corp (PVH), Burlington Stores (BURL), GameStop (GME) and Big Lots (BIG) are several names that have posted strong quarterly results in the past two weeks. Despite all of these solid reports, the S&P Retail SPDR (XRT) broke down with the overall market. Given the upcoming holiday season and recent fundamental strength, it just makes sense that this should be a group to lead the market higher if we see significant technical breakouts, right? Or does it make sense? Check out the "Historical Tendencies" section below for a historical look at retailers.
Sector/Industry Watch
Let's take a look at a screenshot of what was definitely NOT working last week - technology. Here are the one week returns for all of the technology industry groups:
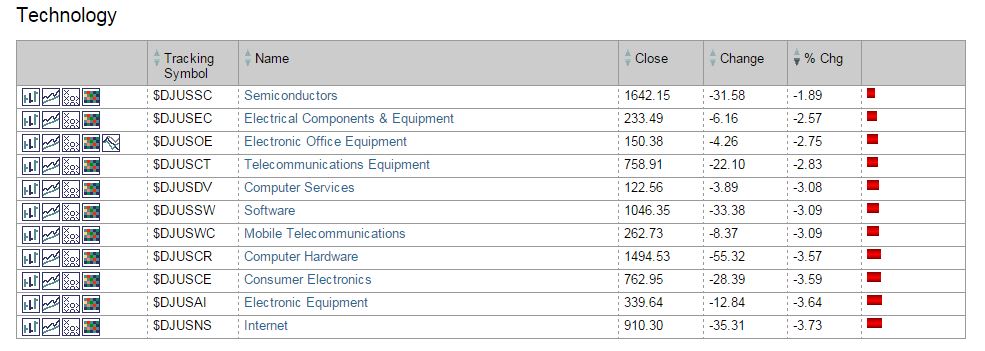
I want to further look into the top performing industry group above - semiconductors ($DJUSSC) - and the bottom performing industry group - internet ($DJUSNS). From this screenshot, you might make the mistake of assuming that the semiconductor group is the better place to invest right now. I wouldn't make that assumption. Check out the two charts:
Semiconductors:
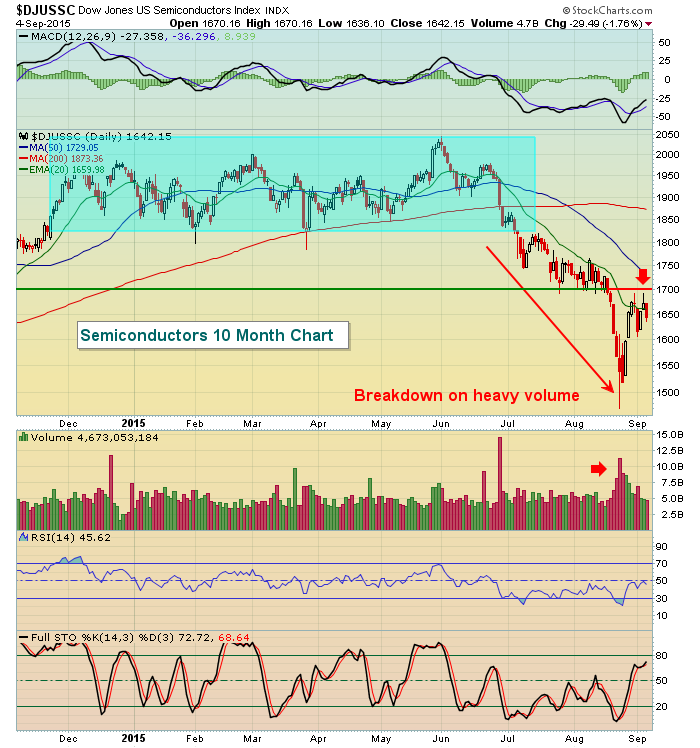
After sideways consolidating for months, semiconductors broke down miserably and were literally free-falling recently. That changed with the bounce, but it's difficult to assume this is anything more than a bounce at this point. The declining 20 day EMA and price resistance near 1700 will be formidable resistance for the semiconductor bulls. It would be a great technical development for semiconductors to regain their strength technically, but I'll need to see it first.
Now look at internet stocks:
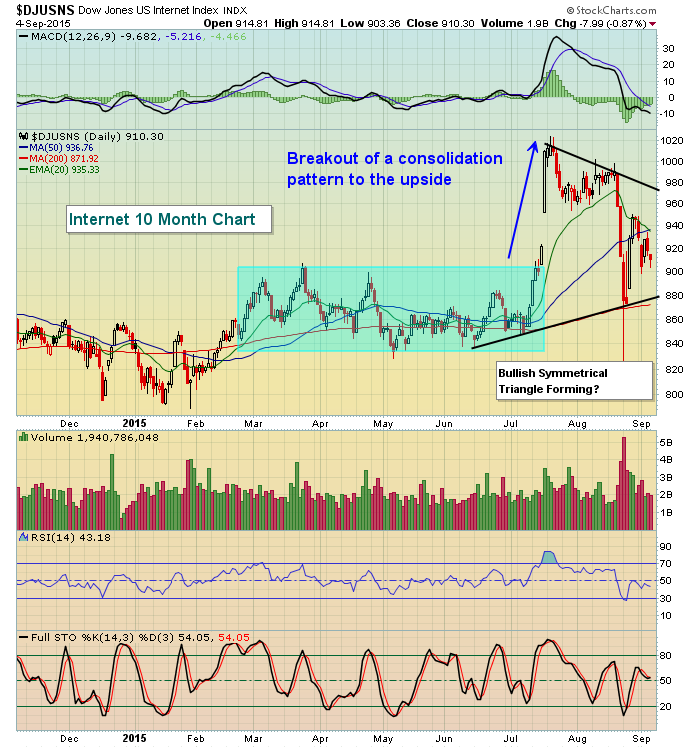
Looking at prior results and making assumptions about future results is what gets most mutual fund investors in trouble. The above is a good example of how rotation works. It's fairly obvious to me that internet stocks are clearly the better choice right now based strictly on technical indicators. However, semiconductors outperformed internet stocks by a wide margin last week as semiconductors benefited from oversold conditions.
Historical Tendencies
I mentioned above that retailers could be an area of the market we look to for leadership. After all, many companies in this space have continued to post very strong earnings and the XLY is home to retail and is the best performing sector over the last day, week and six month time frames. The XLY is the second best performing sector over the past three months and year time frames. The interesting part, however, is that over the past decade retail has performed much better on a relative basis in late winter and early spring. Take a look:
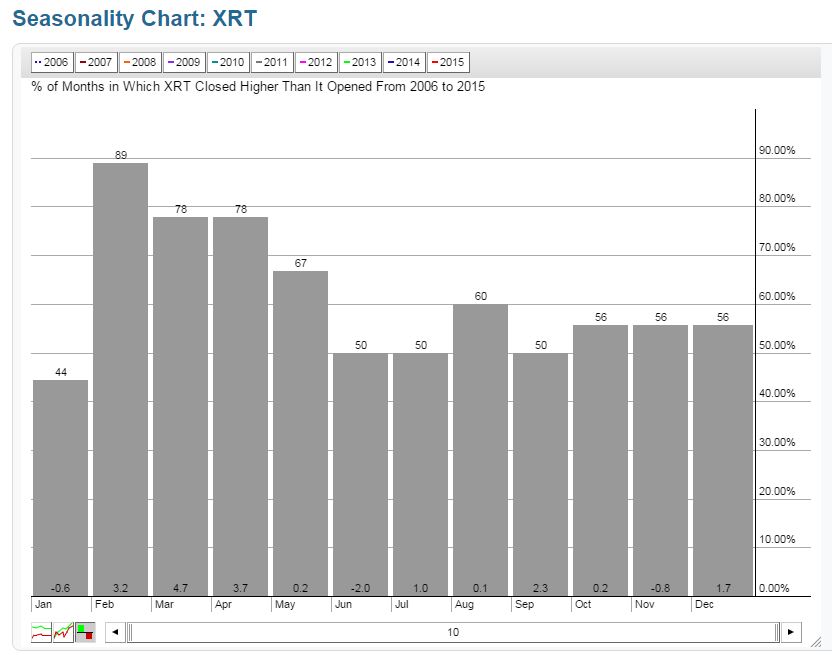
I realize this is only a ten year sample size but the strength has been concentrated mostly from February to April. So while common sense may tell us that retailers should be leaders as we head towards the holiday season, the charts tell us a different story.
Key Earnings Reports
CASY: $1.41 estimate (reports after the bell today)
Key Economic Reports
None
Enjoy your week and happy trading!
Tom


