Market Recap for Thursday, October 15, 2015
On the surface, the big gains yesterday appear quite bullish - and they may turn out to be. There are definitely positives and negatives. On the plus side, volume really accelerated in the final hour or two to support the buying. We saw almost zero selling in the last four hours on Thursday. The stock market also was able to overlook the fact that the 10 year treasury yield ($TNX) continues to hover near breakdown territory at 1.98%-2.00%. The TNX finished yesterday at 2.02%. It's almost as if the stock market and the bond market are anticipating two very different economic pictures. I typically side with what the bond market is saying. The relative performance of the Russell 2000 was all over the map yesterday, but by the close small caps outperformed their larger cap counterparts, another positive.
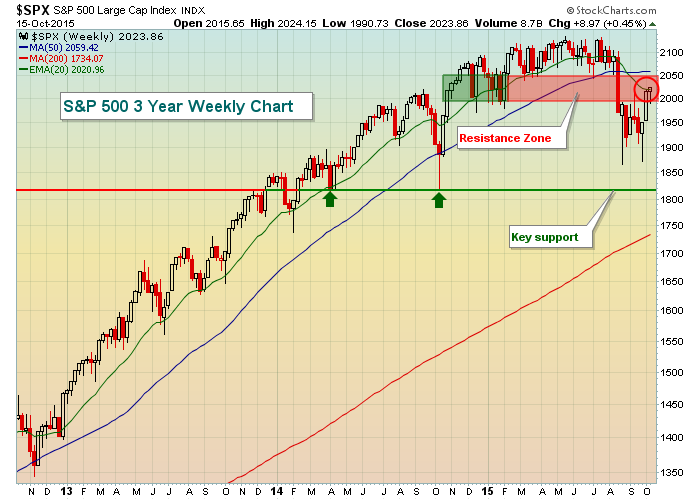
The negatives have been well documented here. The heavy volume breakdowns suffered on the weekly charts are still in need of repair. Looking at the market on a daily basis can be frustrating at times, so I try to step back and look at the bigger picture using longer time frames and weekly charts to get a sense of what's truly taking place. Here's a refresher on the S&P 500:
Thursday caught me off guard. I believed the market was rolling over and we were preparing for another leg lower. But short-term strength can be evaluated by watching those rising 20 day EMAs and so far those are holding on this latest rally attempt. Check out the NASDAQ daily chart (another refresher):
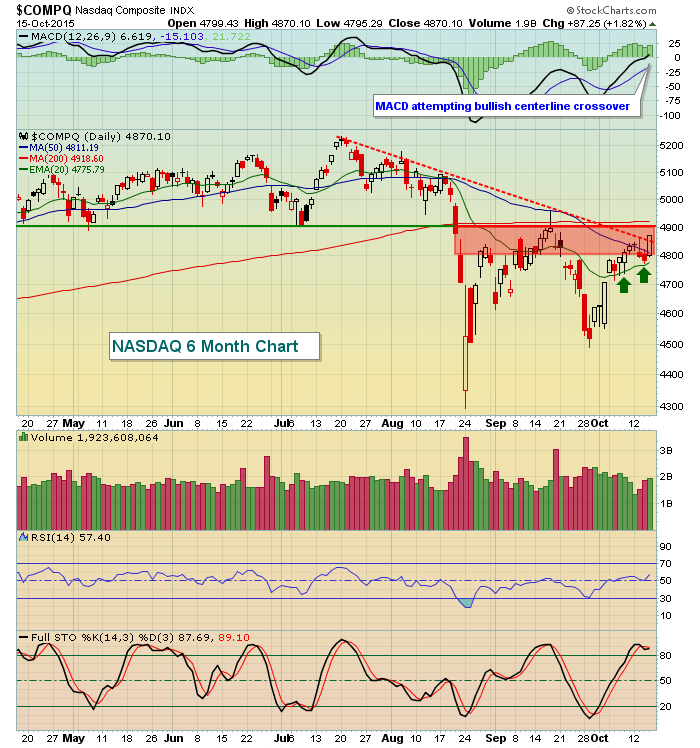
A few points here. First, note that depending on how you draw your trendline (connect either intraday highs or candle bodies), Thursday's gains seem to clear the downtrend line. Second, the MACD has crossed above the zero line, which now suggests bullish momentum. Finally, look at those green arrows marking support at the rising 20 day EMA. That's bull market behavior. So what we have right now is a short-term picture turning more bullish while the intermediate-term still shows that we have key PRICE resistance that must be cleared. On the NASDAQ the 4900-4905 area will be critical while on the S&P 500 look to 2040-2045.
Pre-Market Action
It's a little quiet in pre-market this morning with futures relatively flat. There's been sparse economic news and traders are trying to regroup and reevaluate, especially those on the short side, after Thursday's afternoon rally. The FTSE, CAC and DAX are all higher at last check, but they're off their earlier highs and gains are just fractional. The volatility index ($VIX) fell on Thursday back close to that key 16 level so I'll have my eyes glued on this sentiment indicator. A weekly close much below 16 has historically squashed the bears during corrections. As the VIX falls down into the lower teens, or even lower, boring bullish action generally coincides.
In earnings news, General Electric (GE) and SunTrust Banks (STI) both handily beat earnings expectations and are up by 1.8% and 2.5%, respectively, this morning. Banks had a stellar day on Thursday so more good news out of STI can't hurt. Let's see if financials can muster up more buyers as the day unfolds.
Current Outlook
The bulls are back, well for at least a day. That was an impressive rally on Thursday, namely because it wasn't due solely to a gap like a few recent rallies. Instead, we saw a straight up move beginning at noon EST that didn't stop until the closing bell. Oh the smell of accumulation! Are you confused yet? If so, you're not alone. It's difficult making any sense of this market, especially on an hour-to-hour or day-to-day basis. We're in a "potentially" transitioning market, the kind that makes the least amount of sense. Half the market is accustomed to the comfort of a 6 1/2 year bull market while the other half keeps waiting and waiting for the dreaded bear.
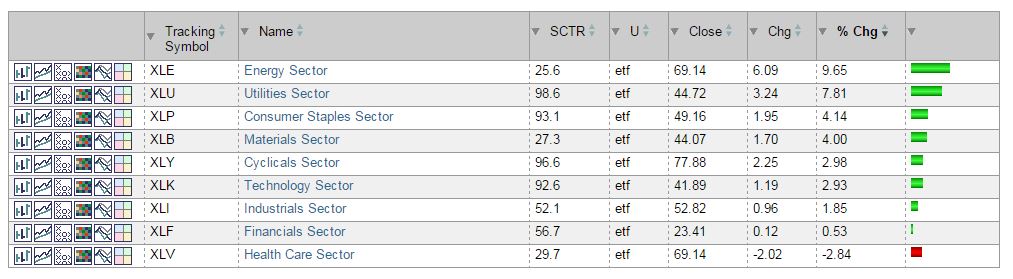
The next chart shows sector performance over a one month period, then the second chart shows the makeup of yesterday's rally:
One month performance:
.....and now what led the market yesterday:
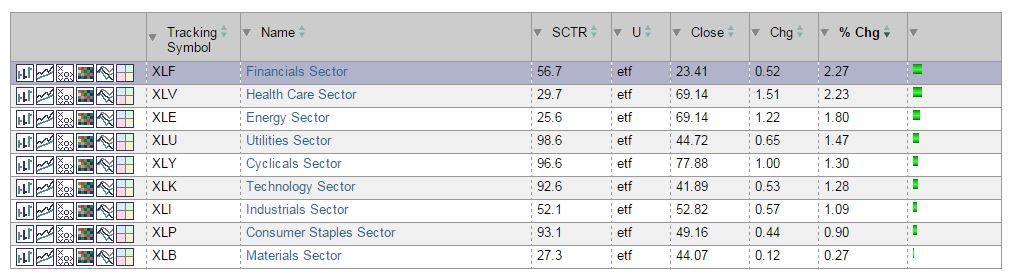
I don't want to downplay the action on Thursday, because it was strong. But if I'm nitpicking a little, do you notice that the worst performing sectors over the past month - financials and healthcare - clearly led the advance yesterday? Beyond those two, the next two "leaders" were energy and utilities, not exactly the relative strength I want to see to support an ongoing bull market. So for every bullish take away, there seems to be a bearish one to go along with it. That's what makes these "transitional" periods or potential transitional periods so difficult to trade. Is this a bear? Is it a resumption of the bull? It really depends on which side you want to argue. The bottom line is that Thursday's action was definitely bullish, but more work is left to do. Given the upcoming bearish period (see details below in Historical Tendencies section), I'm currently remaining defensive despite my longer-term belief that the bull market will resume and this late summer weakness was nothing more than a correction.
Sector/Industry Watch
Tobacco ($DJUSTB) is smoking right now. You won't know there's been a steep correction when you take a look at this chart:
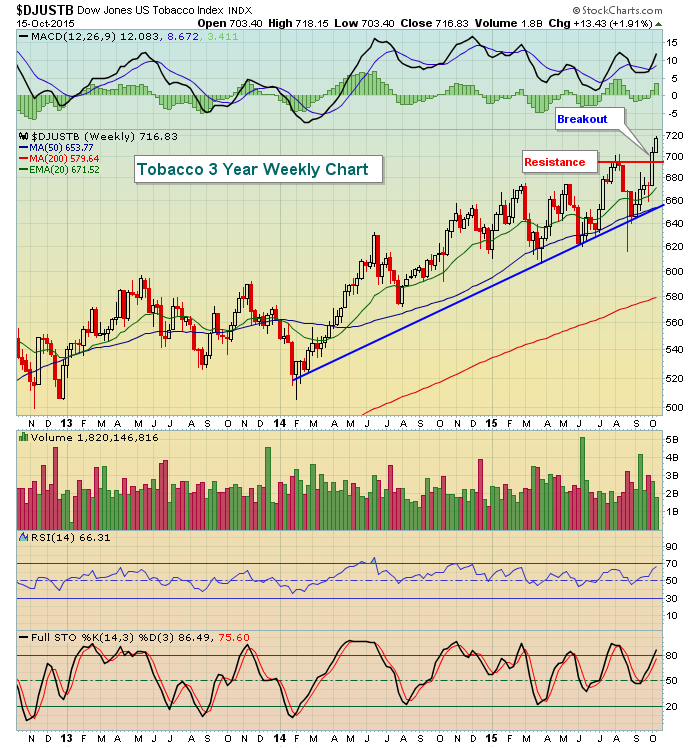
Entry into stocks within this industry group would make sense on pullbacks to test the 695 breakout level and the rising 20 week EMA, currently at 671.
Historical Tendencies
Beginning next Wednesday at the close, history sides with the bears. From the October 21st close to the October 27th close, here are the annualized returns on the following major indices:
S&P 500 (since 1950): -45.19%
NASDAQ (since 1971): -75.79%
Russell 2000 (since 1988): -47.19%
Key Earnings Reports
GE: $.32 (actual) vs. $.26 (estimate)
STI: $1.00 (actual) vs. $.83 (estimate)
Key Economic Reports
September industrial production to be released at 9:15am EST: -0.3% (estimate)
September capacity utilization to be released at 9:15am EST: 77.4% (estimate)
October consumer sentiment to be released at 10:00am EST: 89.5 (estimate)
Happy trading!
Tom


