Market Recap for Wednesday, October 14, 2015
Materials and energy managed to eke out fractional gains, while utilities were flat. Unfortunately, as I evaluate the strength of the stock market, those are not the sectors that heavily influence me. Instead, the other six sectors were lower with consumer stocks being hit especially hard. It's been awhile since consumer discretionary and consumer staples both performed very poorly on a relative basis vs. the S&P 500, but that was the case on Wednesday. Remember the near-term breakout on broadline retailers ($DJUSRB) that I discussed on Monday? Well, thanks to Wal-Mart (WMT) that breakout is gone. It hasn't done anything to the long-term bullishness of the group, but the short-term buy signal was erased. WMT indicated prior to Wednesday's session that they were lowering future guidance and now by just a small margin. Analysts on average were expecting earnings growth of 4% for the year ending January 2017. That apparently isn't going to happen as WMT said to expect a DECREASE of 6% to 12%. That's a major haircut and traders responded about the way you'd expect. Have a look at the carnage:
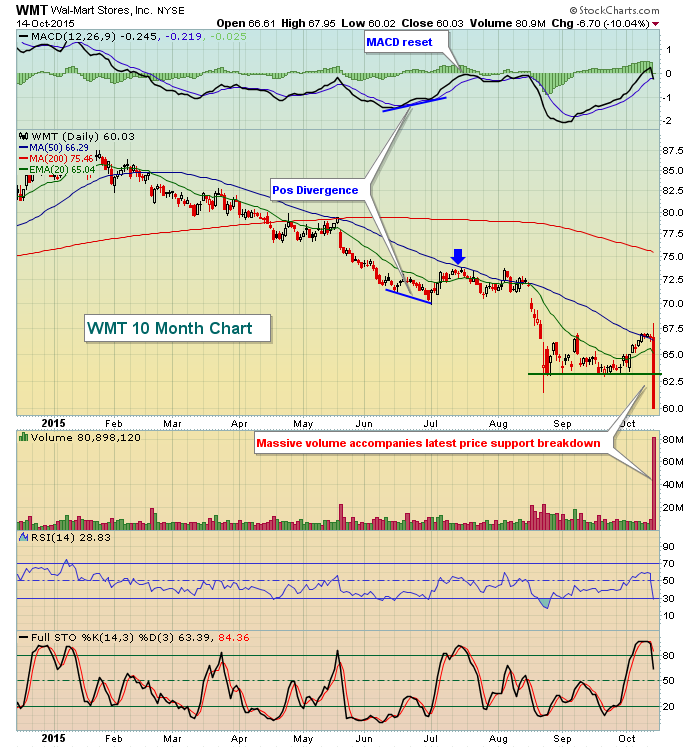
In addition to providing the obvious breakdown on massive volume, I also illustrated above how I like to use the MACD. The downtrend in WMT's share price has been in play throughout 2015, but positive divergences can emerge from time to time to temporarily slow down the selling process. That occurred when lower prices at the end of June were accompanied by a higher MACD price. Instead of a short-term bounce to the falling 20 day EMA, WMT saw a bit more strength as its price climbed to test its 50 day SMA and "reset" its MACD near centerline resistance. Once the selling momentum was wiped out, a new downtrend emerged.
Pre-Market Action
Netflix (NFLX) reported earnings that came up a penny short after the bell last night. Then they guided next quarter's EPS lower. Shockingly, NFLX is down just 3% in pre-market action. It'll be an interesting day of trading for NFLX for sure. Earnings are beginning to come in with mixed results. Banks overall have been disappointing, but Citigroup (C) reported better than expected earnings and is being rewarded in pre-market to the tune of roughly 3%. The 10 year treasury yield ($TNX) is hanging onto 1.98%-2.00% support. A break below 1.98% on a closing basis would not bode well for U.S. equity prices so keep an eye on that.
In Europe this morning, the FTSE, CAC and DAX are all up by more than 1%. The DAX, after failing to break above its 50 day SMA, yesterday managed to hold onto 20 day EMA support. So the DAX is treading water in a tight range between 9917-10210. A break to the downside would likely add selling pressure to U.S. equities while a breakout above 10210 would likely have the opposite effect.
Asian markets were quite strong overnight.
Current Outlook
If you've remained bullish over the past couple months, your mettle has been tested for sure. And the recent rebound in prices off the August low has rewarded you. The good news from the past couple days of selling is that now-rising 20 day EMAs have held on weakness (the Russell 2000 is the lone exception). Furthermore, if you recall, the S&P 500 had struggled on a couple occasions to clear the 1995 price resistance level off of the August low. Once the S&P 500 cleared that broken resistance, 1995 became short-term price support. Wednesday's close was 1994 - close enough - and that level remained well above the S&P 500's 20 day EMA of 1976. But personally, I tend to follow the NASDAQ and Russell 2000 more closely. Why? Well, mostly because they are more aggressive indices and during a bull market they tend to outperform the S&P 500 as traders are willing to take on more risk to achieve higher returns. As I just mentioned, the Russell 2000 had a second consecutive day of very poor action and closed beneath its 20 day EMA after already failing to hold its 50 day moving average and testing its downtrend line. Not good. The NASDAQ, however, did hold onto its rising 20 day EMA and solid futures this morning continue to give bulls hope that the 6 1/2 year bull market is ready to resume. Check out this successful test on Wednesday:
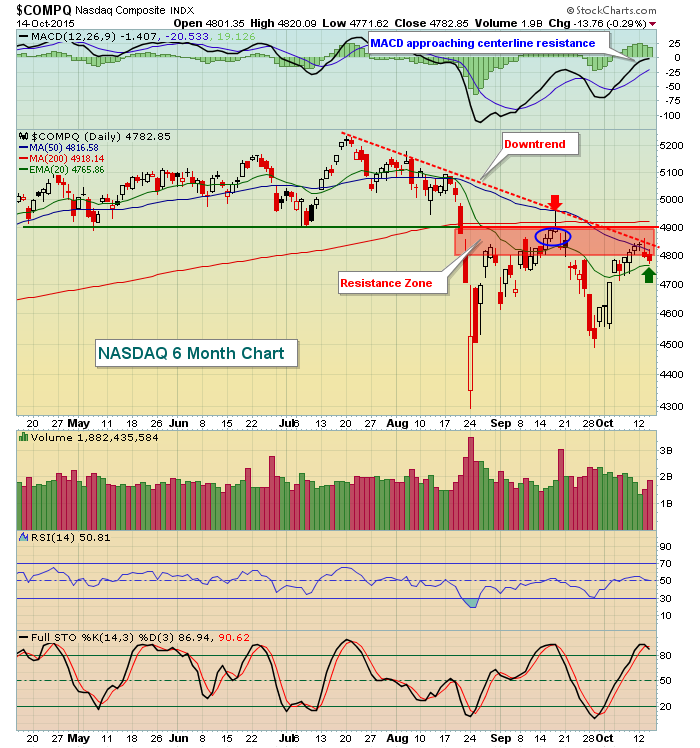
While 20 day EMA support did hold on Wednesday, it's quite clear to me that the bulls still have their hands full with 4800-4900 providing all types of resistance - moving average, trendline, price and gap. Therefore, it will be hard to argue the bull market is resuming because futures are up one morning. There's work to be done and until these various resistance levels are negotiated, we must respect the short- to intermediate-term price breakdowns we experienced in August.
Sector/Industry Watch
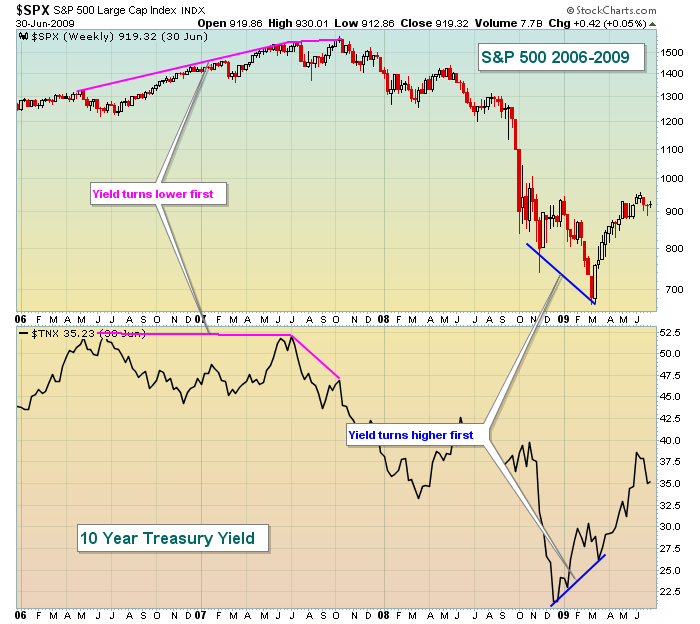
Let's talk bonds. I follow the treasury market very closely every day even though I never trade treasuries. I do it for intermarket analysis reasons. Investors have a choice to make every day they invest one dollar. Do they want to invest that dollar in the more defensive treasury market or do they want to take more risk in equities to try to achieve higher returns. It's that latter attitude that sustains bull markets. When traders begin to shy away from risk and expected volatility grows, bear markets are born. Or as I like to say, the conditions are solid for a bear market to be born. As bull markets flourish, money rotates AWAY from treasuries to help fuel the rise in equity prices. The selling of treasuries sends treasury prices lower and yields higher as yields always move inversely to treasury prices. In 2010 to 2012, we had a period of quantitative easing (QE) that saw treasury prices and equity prices move up in unison. That generally doesn't happen. Recently, in the very near-term it's been happening again. Perhaps the market is anticipating that the Fed will announce further accommodative measures that are "QE-like". I can't imagine that to be the case, but I suppose anything is possible. Instead, the recent divergent move between the S&P 500 and the 10 year treasury yield ($TNX) needs to be rectified. I normally view the treasury market to be more accurate in predicting the direction of the U.S. economy and right now it's screaming to be cautious. The Russell 2000, an index comprised of smaller companies that do most of their business here in the U.S., has been lagging their larger, multinational counterparts badly. That's also a sign of a weakening economy ahead.
Let me give you an example of how the treasury market can send signals AHEAD of the stock market:
Now let's fast forward to the relationship between these two over the past six months:
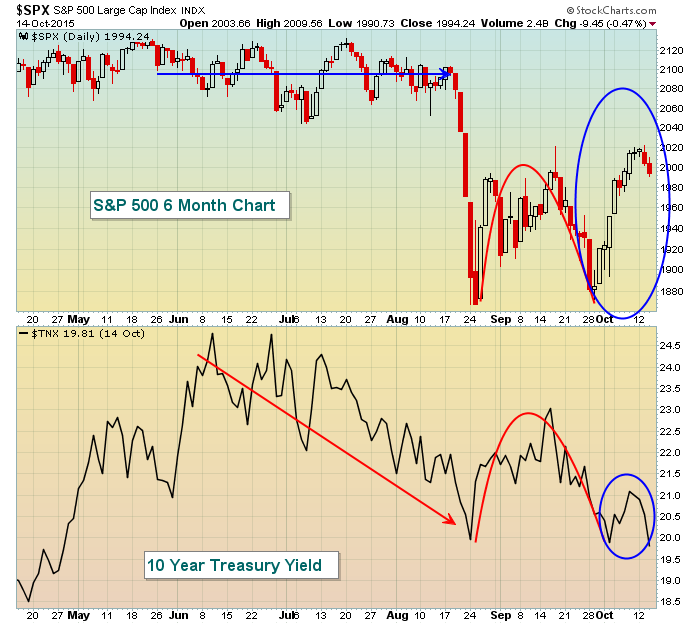
A couple points need to be made here. First, as with every chart I illustrate, the above guarantees us NOTHING. I've seen perfect setups destroyed so always make sure you have stops in place. Having said that, I do find the action in the treasury market to be very odd since June. While the S&P 500 moved sideways from June to August, money began rotating into treasuries with the TNX dropping from 2.45% to 2.00%. After the big drop in the S&P 500 during August, we saw similar rebounds in both equities and treasury yields in September. But the October action has me scratching my head. The S&P 500 has rebounded very nicely while the TNX tests support just below 2.00%. It's almost as if the treasury market remains focused on the FOMC announcement on September 17th and is viewing how the Russell 2000 is performing - both of which suggest a lot of economic uncertainty here in the U.S. Meanwhile, traders of the S&P 500 keep sipping the Kool-Aid. Hhhhhhhmmmmmmmmmm, let's see how this plays out over time.
Historical Tendencies
There tends to be back and forth action from now until the close on October 21st so perhaps that's what we're setting up for - sideways consolidation. Clearly, it would be much better for the bulls to breakout to the upside prior to next week's bearish historical period. Resting just beneath price resistance as we enter the most bearish week of the year wouldn't seem to be the best idea. Again, time will tell.
Key Earnings Reports
C: $1.31 (actual) vs. $1.29 (estimate)
GS: $2.90 (actual) vs. $3.23 (estimate)
UNH: $1.65 (actual) vs. $1.63 (estimate)
SCHW: $.26 (estimate) - scheduled to report this morning before the opening bell
Key Economic Reports
September CPI released at 8:30am EST: -0.2% (actual) vs. -0.2% (estimate)
September Core CPI released at 8:30am EST: +0.2% (actual) vs. +0.1% (estimate)
Initial jobless claims released at 8:30am EST: 255,000 (actual) vs. 270,000 (estimate)
October empire state manufacturing released at 8:30am EST: -11.36 (actual) vs. -7.00 (estimate)
October Philadelphia Fed business outlook survey to be released at 10:00am EST: -1.0 (estimate)
Happy trading!
Tom


