Market Recap for Thursday, October 1, 2015
We finished on a strong note on Thursday by rallying into the close and ending near highs of the day across our major indices - very similar to Wednesday. Unfortunately, the strength was centered in materials and healthcare, two of the three worst sectors in terms of one month performance. Neither cleared short-term price resistance or 20 day EMAs on the bounce so it's difficult to grow overly optimistic at this point. Still, up is up and the bulls are definitely putting up a fight as we heading into the Friday jobs report. Another positive is that volume was once again heavy with prices rising in the afternoon. That's typically a sign of a continuing rally, but with the jobs report due out Friday morning and the Volatility Index ($VIX) remaining in the 20s, literally anything goes.
Weakness was felt primarily by utilities on Thursday as three of our aggessive sectors - technology, financials and industrials - finished the session near flat. Only consumer discretionary performed well, gaining 0.74% with industry strength from furnishings ($DJUSFH) and hotels ($DJUSLG). Both of these industry groups were simply bouncing off oversold conditions, however. They were not making any significant technical breakouts.
Pre-Market Action
September jobs came in disappointing (see Key Economic Reports section below) and U.S futures have sold off very sharply from earlier gains. Trading in Europe, particularly the German DAX, failed to clear short-term resistance yesterday, but we were seeing strength in that region prior to the U.S. jobs report, helping to pave the way higher for the early U.S. gains. Clearing the 9750-9800 level on the DAX would be bullish, but technical analysis would tell us to expect failure at that zone until proven otherwise. Yesterday's weak finish on the DAX was quite bearish.
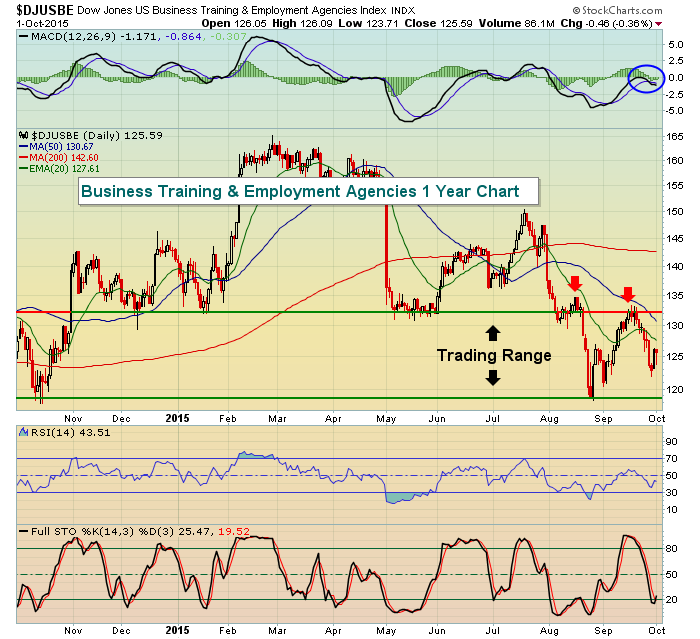
If the market was anticipating an upside surprise to the jobs numbers, I would have been looking for areas like business training and employment agencies ($DJUSBE) to perform well leading up to this report. Instead, the DJUSBE finished down on Thursday, though it did rally in the last few hours with the overall market. A solid jobs report and a technical breakout on the DJUSBE would have been nice. Now the bulls can only hope for the latter. Here's the chart with key levels to watch:
With U.S. stock futures declining, bond traders in recent days have reacted the way I would expect - anticipating job weakness. In fact, money has been rotating into treasuries the past couple weeks with the corresponding 10 year treasury yield falling. That generally is a warning sign for equities so something had to give soon. It appears there'll be selling in the S&P 500 to play catch up with what bond traders have been telling us the past couple days. Here's an illustration of the recent divergence:
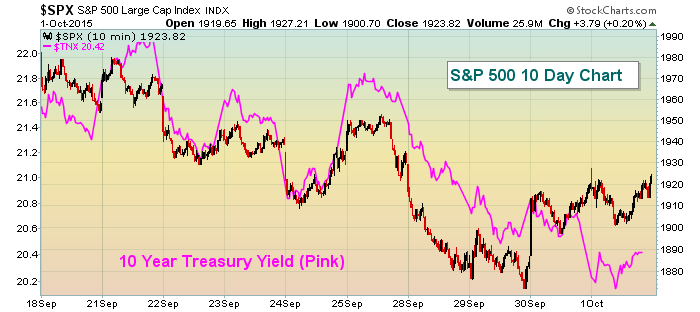
While it's not unusual to see these two markets diverge from time to time, you can also see they tend to catch up with one another and ultimately move in the same direction. Over the past two trading sessions, the S&P 500 has rallied on hopes of economic strength while the TNX has fallen as bond traders see little prospects for such strength. The relationship between these two lines, given the disappointing jobs numbers this morning, will likely be the most intriguing aspect of today's action. Stay tuned.
Current Outlook
Perhaps the biggest issue the market faces right now, other than the obvious high volume breakdowns in August, is the high volatility and what that can mean for stock market performance. To illustrate, let me provide you a long-term chart of the S&P 500 and how it performs in various environments:
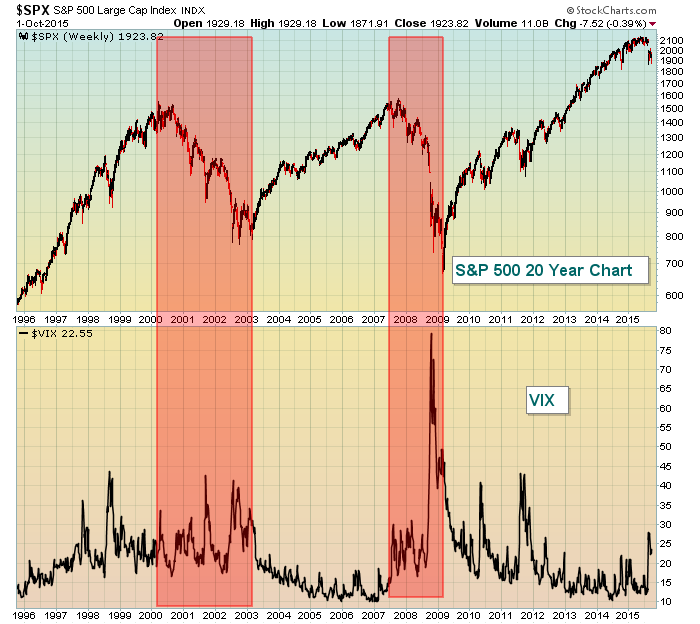
One conclusion that can be drawn from the above is that bear markets occur with VIX readings that generally remain at 20 or above. Corrections will see spikes in volatility, but the VIX quickly subsides as the bull market resumes. When we begin to see large spikes in the VIX and it remains elevated, that tells us to be more cautious. Also, a rising VIX PRIOR to market weakness should be cause for concern. 1998 and 1999 both showed the VIX remaining above 20 before the bear market kicked in during the first quarter of 2000. In 2007, traders were very complacent early in the year with VIX readings at 10. But notice the VIX rising BEFORE the October 2007 market top? The first spike in the VIX above 30 occurred in the summer before the October top. That suggests it's time to at least grow more cautious. Then price breakdowns began on the heels of a more fragile market psyche. From that 2007-2009 bear market, the VIX again downtrended for years as the S&P 500 started its next bull market, which still continues in my view. HOWEVER, this latest spike in the VIX (above 50 intraweek) tells us to be cautious, especially given the heavy August selling. Losing the October price support with volatility readings already elevated would be a big problem. When the selling in October 2014 hit, the VIX was coming off lows near 10. That allowed the market to recover quickly as fear subsided almost as fast as it began. But the volatility readings are now remaining above 20 a full five weeks after the major selling event. That has traders on edge and why we continue to see impulsive selling more frequently. If the bull market is to continue, we need to rid ourselves of VIX readings above 20.
Sector/Industry Watch
I grow nervous whenever I see gas prices falling at the pump. That may sound strange because everyone likes cheap gas, right? Companies and industries where crude oil ($WTIC) is a big expense flourish as prices fall. Think airlines for instance or just about any business that transports people or goods. So why should we fear lower crude oil prices? Well, keep in mind that the same things that "fuel" the stock market also trigger higher crude oil prices. Many of the S&P 500 companies rely upon a strengthening global economy to produce higher top line and bottom line results. That same strengthening global economy also tends to drive crude oil prices higher. It's Economics 101. Remember supply vs. demand? In chart form, let me show you how the S&P 500 and crude oil prices have compared since the turn of the century:
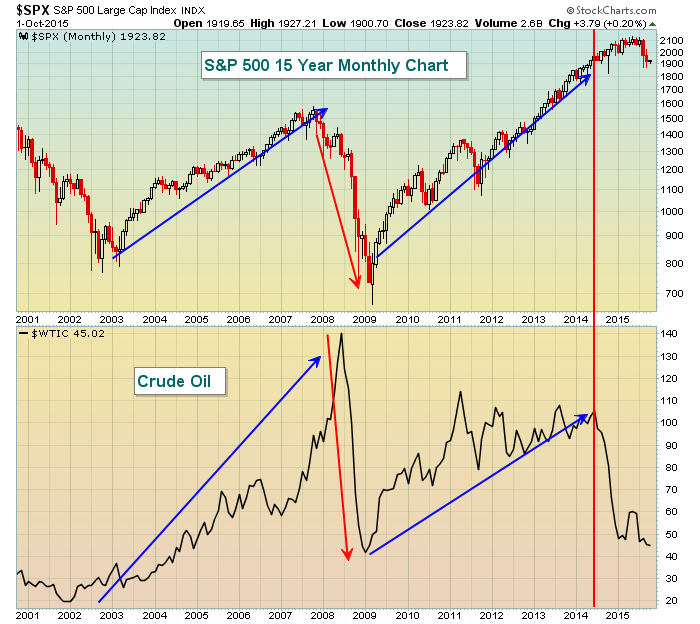
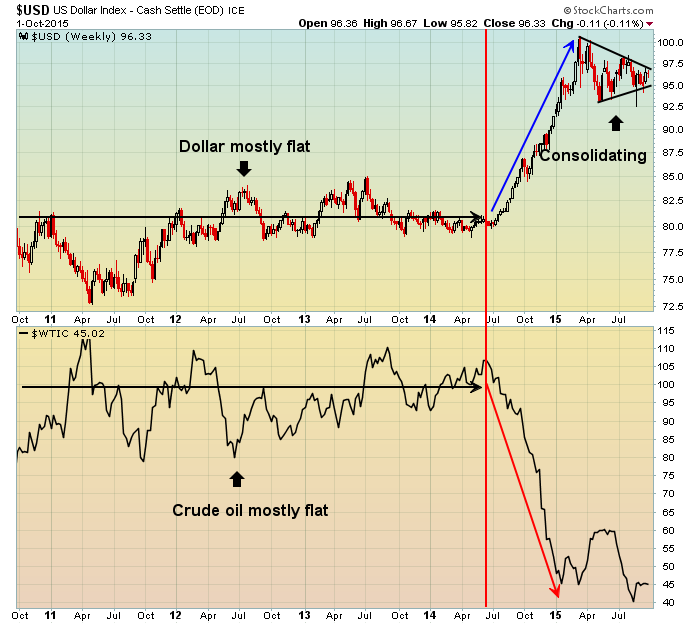
The timing of the direction changes in each isn't perfect, but the extended directional moves have gone mostly hand in hand the past 15 years - until the last year. What's happened? Well, I have two theories. One is that the U.S. economy has been stronger than globall economies allowing the U.S. market to outperform crude oil. The second issue and probably the bigger issue is the rising dollar. The sudden downturn in crude oil occurred in mid-2014. Take a look at the U.S. dollar and the move it made starting in mid-2014:
The $45-$50 per barrel crude oil price provided support earlier in 2015 and it's now providing resistance. If we could see crude oil break back above $50 per barrel, that could begin to suggest global economies are improving and could provide bullish tailwinds for U.S. equities. But thus far, it hasn't happened and many analysts are arguing for cheap oil over the long haul. We'll see.
Historical Tendencies
Since 1950, the S&P 500 has gained ground during the month of October 60% of the time (39 times higher, 26 times lower). October has produced annualized returns of 10.01% over the last 65 years, which is slightly better than the S&P 500's 9% average annual return over that same period.
Key Earnings Reports
None
Key Economic Reports
September new jobs released at 8:30am EST: 142,000 (actual) vs. 203,000 (estimate)
September unemployment rate released at 8:30am EST: 5.1% (actual) vs. 5.1% (estimate)
August factory orders to be released at 10:00am EST: -1.3% (estimate)
Happy trading!
Tom


