Market Recap for Wednesday, September 30, 2015
The month of September and the third quarter of 2015 came to a close on Wednesday and the bulls were able to reduce their losses for the month and quarter. The S&P 500 finished September down 2.6% while the tumultuous third quarter ended with the S&P 500 giving up nearly 7%. More glaring, perhaps, was the Russell 2000 losses of 5.1% and 12.2%, respectively, for those same two periods - monthly and quarterly. So if it wasn't bad enough that traders were bailing out of U.S. equities in general, the fact that the Russell 2000 was hit much harder resonates with those looking for clues about the U.S. economy. The Russell 2000 is the home to smaller capitalization stocks that do most of their business here in the U.S. While the Federal Reserve seems to be mostly concerned about economic strength outside our borders, traders are voting with their portfolios that we better worry about our own economic issues.
All of our major indices and all nine sectors finished higher on Wednesday, led by consumer discretionary and energy. There were a couple of positives from Wednesday's action. One was that volume was very heavy on the rebound. A light volume rebound would certainly have raised more red flags. The heavy volume doesn't guarantee us that a bottom is in, it's simply better than the light volume alternative. The second positive was that we saw a strong afternoon rally after it appeared the early strength would disappear. One of the hallmarks of bear markets is impulsive selling episodes and we were set up for one of those as we entered the second half of trading yesterday. Take a look at this 10 minute intraday chart of the NASDAQ:
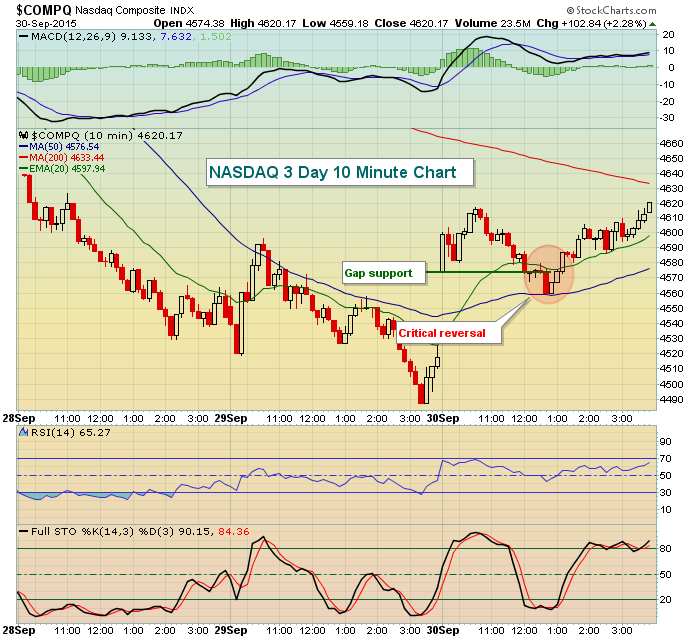
The red shaded area shows that at the start of the noon hour, the NASDAQ fell below its opening gap. 20 minutes later, it reversed higher and failed to clear the declining 20 period EMA - a bearish development. That was then confirmed by the largest red-filled candle of the day as the selling accelerated. At that point, it appeared as if we might lose all of the gains earlier in the session, which would have been extremely bearish action. Instead, the bulls picked themselves up off the floor and printed the bullish three white soldiers candle pattern. The rising 20 period EMA then held as support the rest of the trading session as the NASDAQ closed on its high of the day. That kind of action is usually rewarded with more strength the following day and that's what we're seeing with futures this morning.
Pre-Market Action
U.S. futures remain higher, but are well off their earlier highs. When volatility strikes, it usually strikes the pre-market action and we're seeing that this morning. Celgene (CELG) and SanDisk (SNDK) both received upgrades and are trading modestly higher.
Action in the treasury market is perplexing. Bond traders are not buying into this equity rally. The 10 year treasury yield ($TNX) stands at 2.04% this morning, not rallying at all to support yesterday's equity advance. I like to overlay the TNX with the SPX to spot inconsistencies as they usually move in unison in the near-term. Take a look at what happened yesterday and thus far this morning:
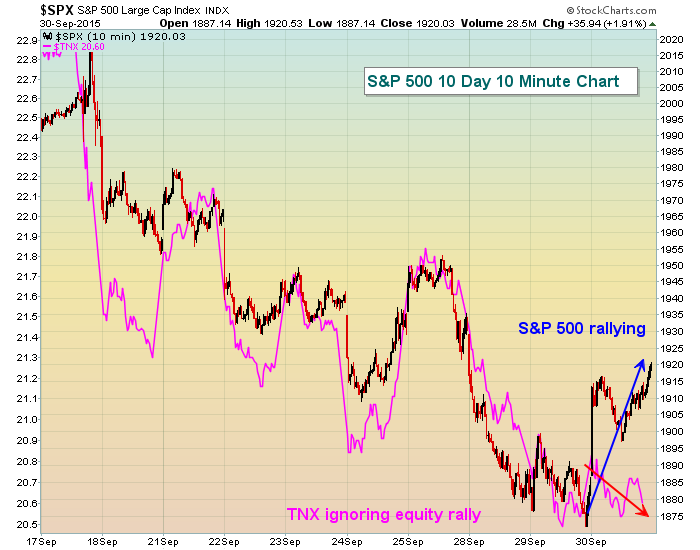
I usually have more confidence in bond traders. If the yield is moving lower, it signals that treasuries are being bought. Treasuries being bought is a sign of caution and is defensive by nature. When equities rally, I want to see aggressive activity. I want to see treasuries SOLD with yields RISING. So while yesterday's equity rally is nice, we are not in a "full speed ahead" environment. A big move higher today in treasury yields would be a big bonus to equity bulls, but I need to see it first. If yields fail to rise today, I'd view that as a major red flag for this equity rally. Today should be yet another interesting day.
Current Outlook
The good news is that the short-term remains bullish and we're in a bull-friendly time of the month when money inflows typically lead to higher equity prices. The primary question is where should we begin to question this rally? I provided a 10 minute intraday chart of the NASDAQ above, illustrating the kick save that the bulls made. Let me stretch this chart out to a few weeks using a 60 minute timeframe and you can see a few technical obstacles ahead:
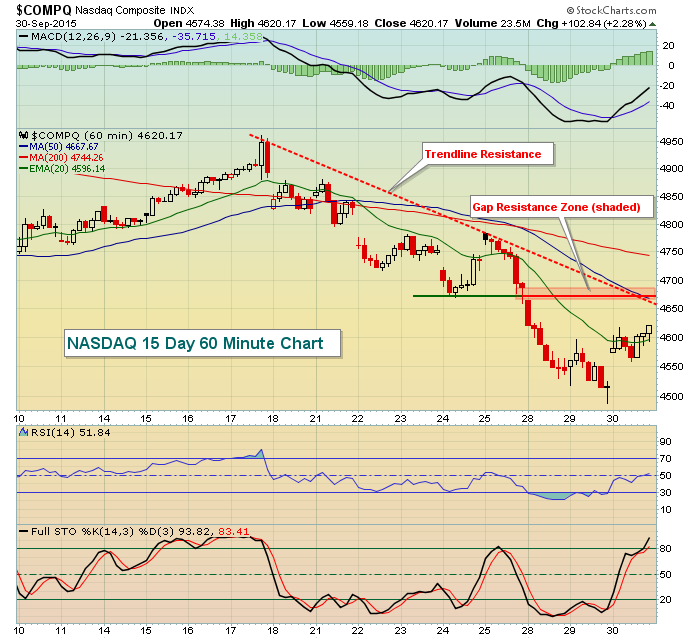
Price resistance is at 4670, the top of gap resistance is at 4686 and the bottom of gap resistance is at 4665. Throw in the 50 hour SMA at 4668 and there are a host of reasons for selling there. Should the bulls continue to show nice volume and are able to negotiate this resistance, then a 20 day EMA test becomes much more likely on the daily chart and the NASDAQ's 20 day EMA currently stands at 4736. For now, I'd view these levels as potential turnaround points if you're in the bearish camp. For those in the bullish camp, the best case scenario is obvious - that a double bottom at 4500 is now solidly in place and we're resuming the 6 1/2 year bull market that began in 2009. That argument is in place as long as 4500 closing support holds. I still favor the latter argument, but with volatility so high and all of our major indices still broken technically on the daily charts, we need more confirmation.
Sector/Industry Watch
On Wednesday, there were only two industry groups that finished in negative territory. In the consumer staples sector, nondurable household products ($DJUSHN) were lower by .38% and in the industrial space, trucking ($DJUSTK) had the dubious distinction of being the worst performing industry group on a very bullish day, dropping 0.73%. The chart on truckers, however, is quite bullish and will likely resume its uptrend if, in fact, we remain in a bull market and the past few months simply represents a normal correction. The daily chart doesn't look so great, but let's take a bigger picture view and see what you think:
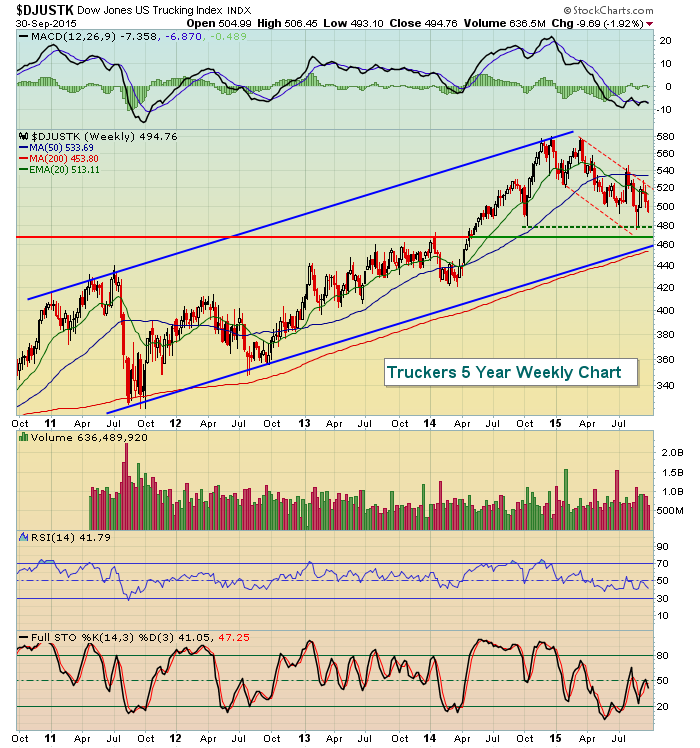
The solid blue parallel uptrend lines show us that a nice channel is in play over the longer-term. Note that the bottom of that channel now nearly coincides with price support from the April 2014 breakout of prior resistance - close to the 470 level. Recent 2015 lows are just below 480. The red dotted lines show a 2015 down channel currently in play. So we have a long-term bullish pattern with a shorter-term bearish downtrend inside it. I believe the truckers are at or very close to a buy signal. If the technical picture above isn't enough, consider how well the DJUSTK performs in the fourth of the year historically. Check this out:
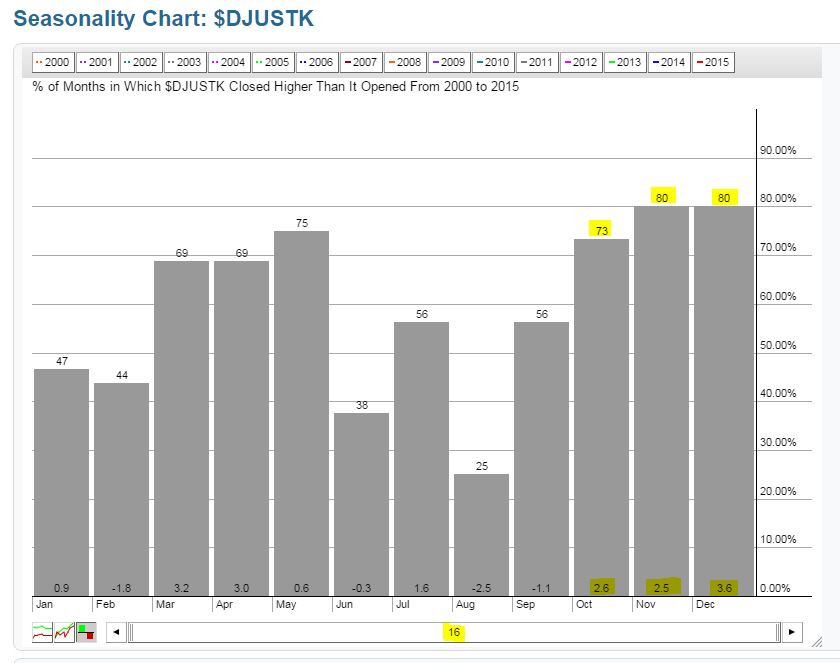
The next three months tend to be very bullish for truckers. That doesn't necessarily mean we'll see strength beginning on October 1, but if prices in this industry group continue to fall, not only does the reward to risk become stronger, but you also have the knowledge that we're in a sweet spot for the group historically. That provides me more confidence to place the trade.
Historical Tendencies
I've mentioned in the past that the first week of most calendar months is very bullish. In fact, on the S&P 500, consider the following annualized returns from the 1st through 6th calendar days of the month (since 1950):
1st: +46.63%
2nd: +38.35%
3rd: +26.53%
4th: -0.23%
5th: +30.09%
6th: +16.39%
This isn't just October 1st through 6th. The above represents the annualized returns for all the 1sts of the month (January (holiday), February, March, April, etc). Given that the S&P 500 has average annual returns of roughly 9% over the past 65 years, it's fairly obvious to me that the 1st to 6th of the calendar month is generally a period of outperformance - not every month, but I'm talking about ODDS here.
For whatever reason, the Russell 2000 does not show a strong history in early October. Instead, it shows a negative annualized return for 8 of the first 9 calendar days in October. The annualized return for the Russell 2000 during this period: -79.13%. OUCH!
I can't explain the relative weakness for small caps in early October, but I do pay attention to it. If I'm going to trade on the long side this time of the month, I tend to stick with the bigger names.
Key Earnings Reports
MKC: $.85 (actual) vs. $.87 (estimate)
Key Economic Reports
Initial jobless claims released at 8:30am EST: 277,000 (actual) vs. 272,000 (estimate)
September PMI manufacturing index to be released at 9:45am EST: 53.0 (estimate)
September ISM manufacturing index to be released at 10:00am EST: 50.5 (estimate)
August construction spending to be released at 10:00am EST: +0.6% (estimate)
Happy trading!
Tom


