Market Recap for Monday, October 19, 2015
It was mostly bifurcated action throughout Monday's session with the NASDAQ leading. The Dow Jones and S&P 500 did manage to finish with gains after rallying in the final two hours. Among sectors, consumer stocks resumed their leadership role with discretionary and staples stocks holding down the top two spots. Technology and healthcare also performed well on a relative basis, while energy was the overwhelming laggard. Thus far, the selling in energy is nothing more than short-term profit taking after a stellar advance. The following 60 minute chart reflects a nice bull flag pattern awaiting resolution:
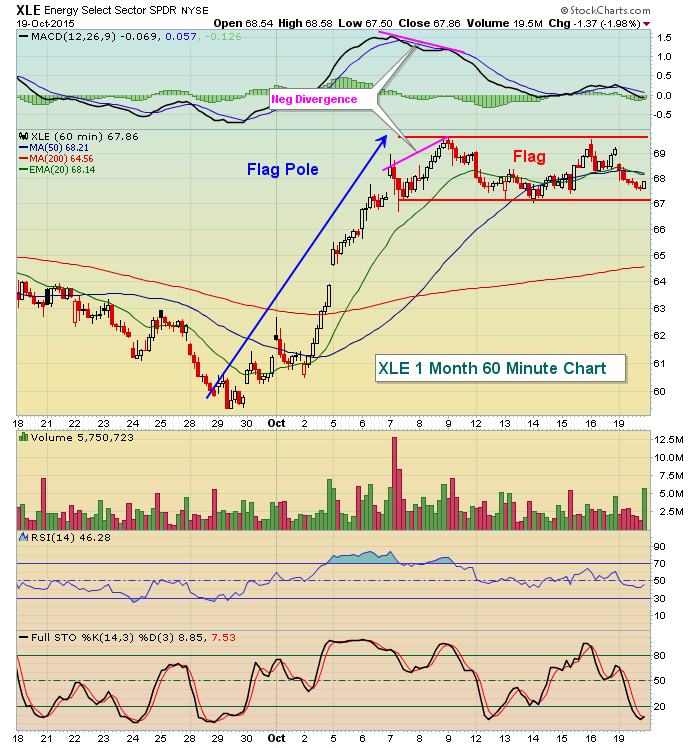
You can see from this chart the beautiful recovery in energy. Note that at the end of the recent rally, a negative divergence printed on this 60 minute chart. Short-term traders should take note of these types of divergences to consider taking profits, especially if price resistance is not evident. The price support in this flag (bottom horizontal red line), along with rising 20 day EMA support (not reflected on above chart), currently at 66.39, are the two key areas that I'd expect the bulls to defend.
Pre-Market Action
Recently, we've seen the market start off in negative territory only to finish strong. That appears to be the case in the early going once again as European indices have been in the red since their respective opens. But they are battling back and are off their worst levels of the morning. That, in turn, has enabled U.S. futures to also work back off their earlier pre-market lows.
Current Outlook
Honestly, I believe the action recently supports the continuation of the 6 1/2 year bull market and eventually we'll look back on this as a deep correction similar to 2011. Clearly, there's much more work to be done, but we're nearing the conclusion of the historically weaker July to October period, the VIX is dropping to levels normally not seen in bear markets and thus far price resistance has done little to deter buying, much less spur another impulsive selling episode. This could change so we must keep our guard up, but if this upcoming historically bearish week can's generate sellers, I'll begin to wonder how the next shoe drops.
Housing has been a driving force behind the potential continuation of the 6 1/2 year bull market. The Dow Jones U.S. Home Construction index ($DJUSHB) consolidated for nearly two years from its May 2013 high in an ascending triangle pattern. The breakout in 2015 has not reached its measurement to 710 (it currently trades at 583) so there's plenty of upside available for home construction to lead the stock market higher.
The September housing starts and building permits were just released and showed a mixed bag. Housing starts beat estimates while building permits fell short. I'll be watching to see how traders react to this report later today. For now, the ITB (ETF that tracks home construction stocks) continues its short-term downtrend within a longer-term bullish pattern. Therefore, a break above the downtrend line and price resistance represents a buy signal for me in the housing space. Check this out:
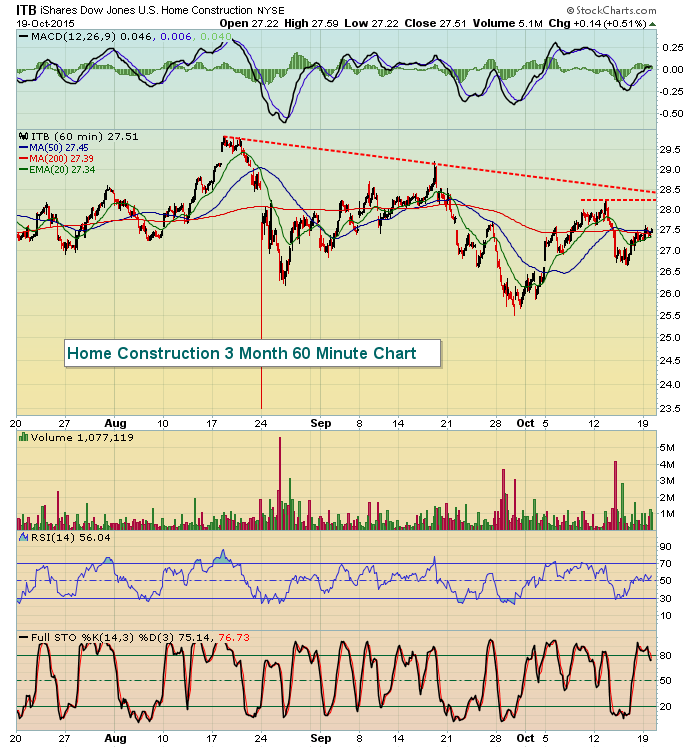
The trading range to watch is 28.25-28.50 on the ITB. A breakout above this area continues the recent uptrend and potentially sends the DJUSHB to its measurement near 710.
Sector/Industry Watch
Let's take a look at the U.S. dollar. After any major advance, I look for continuation patterns to develop as traders take a breather and allow a stock, index, ETF, currency, etc. to consolidate. In the case of the dollar, we saw a very significant move higher (25%) in roughly a six month period. Many traders are impatient and maybe even growing nervous as the dollar has failed to build on those gains. I believe we'll see the dollar continue its advance once its current continuation pattern reaches its conclusion and eventually breaks - and I believe it'll break to the upside. That breakout would be bad news for the commodities area, which has already been weakened by a number of factors including that dollar strength. Check out the chart below:
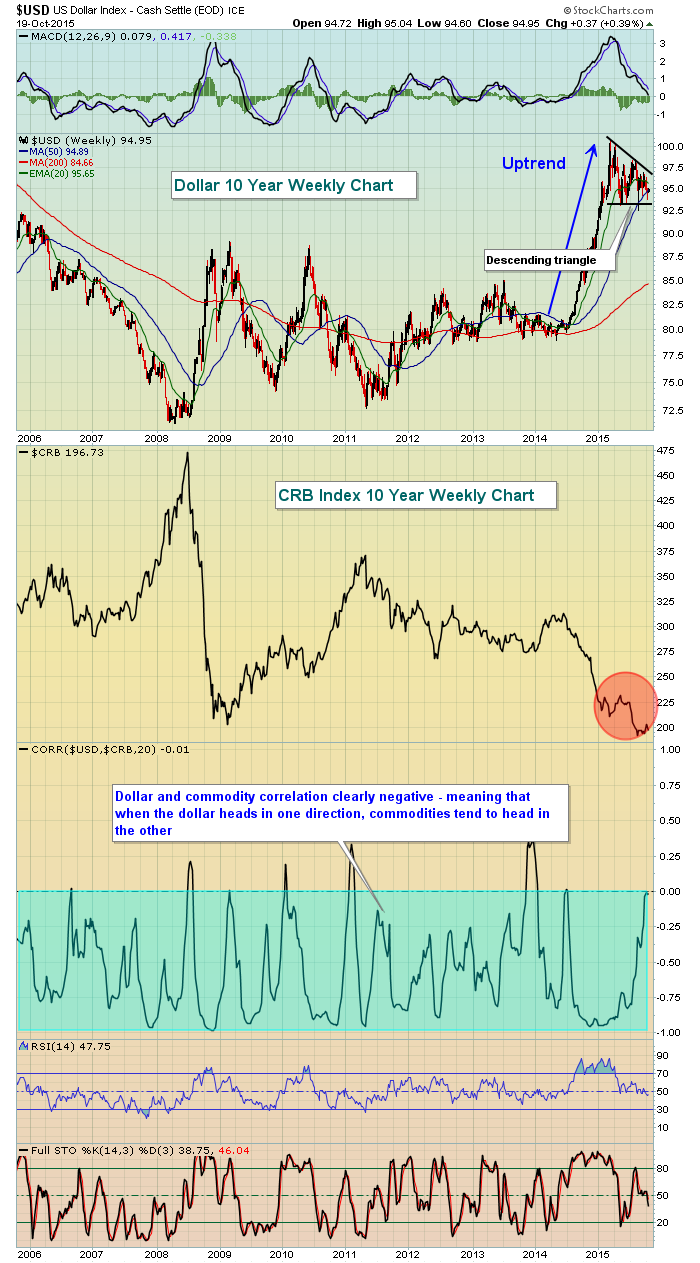
The negative correlation between the U.S. dollar and commodities should be obvious as the correlation indicator remains in negative territory throughout the past ten years. The scary part is that while the dollar has been drifting lower in its current descending triangle pattern, commodities have continued to struggle (red shaded area). Perceived global economic weakness is not helping the commodities market. As far as the triangle, I prefer ascending triangle continuation patterns over descending triangles after an uptrend, but both can signal continuation of the prior trend on a breakout. I have found the ascending triangle patterns to be more reliable, though.
Historical Tendencies
October has a bad reputation because of big losses in a few years, but its longer-term tendency is to perform about average compared to the S&P 500's performance throughout the calendar year. Tomorrow's close, however, does mark the beginning of the worst historical week of the year. I'll post a reminder of annualized returns for each of the calendar days within this bearish period in tomorrow's report.
Key Earnings Reports
(actual vs. estimate)
AMX: (.05) vs. .23
BK: .74 vs. .71
LMT: 2.77 vs. 2.70
TRV: 2.93 vs. 2.21
UTX: 1.67 vs. 1.54
VZ: 1.04 vs. 1.02
(reporting after the closing bell today)
BRCM: .73 (estimate)
CMG: 4.62 (estimate)
DFS: 1.34 (estimate)
ISRG: 3.61 (estimate)
VMW: .74 (estimate)
YHOO: .07 (estimate)
Key Economic Reports
September housing starts released at 8:30am EST: 1,206,000 (actual) vs. 1,147,000 (estimate)
September building starts released at 8:30am EST: 1,103,000 (actual) vs. 1,170,000 (estimate)
Happy trading!
Tom


