Market Recap for Tuesday, October 20, 2015
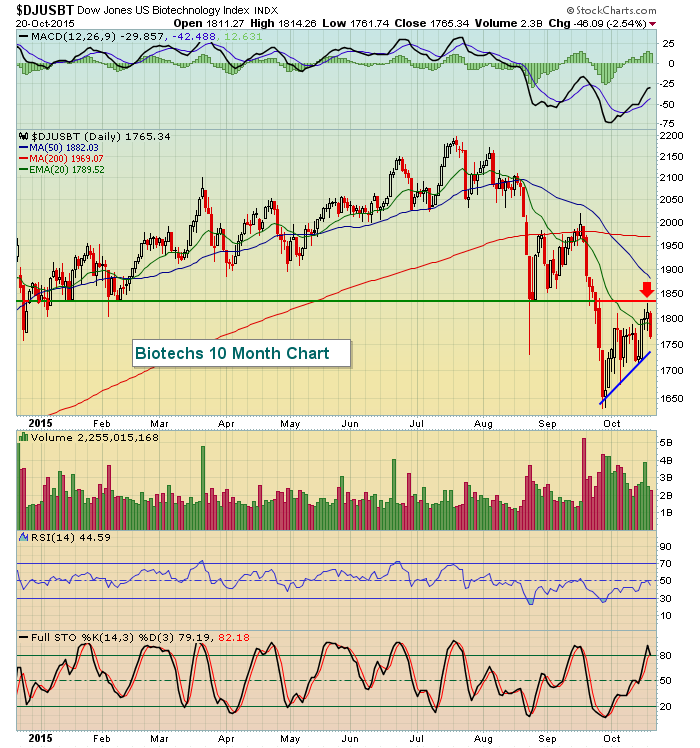
The Dow Jones U.S Biotech Index ($DJUSBT) fell 2.5% on Tuesday, failing to hold onto the 20 day EMA it had barely broken above the prior three trading sessions. That led to a healthcare group that lagged the overall market badly and once again sets the industry up for potential losses in the near-term. On the chart below, you can see biotechs attempt - and failure - to right its ship technically:
In addition to woes in healthcare, IBM dropped another quarterly earnings bomb on the market. They managed to eke past EPS estimates but revenues again came up short and future guidance was slashed. That led to a 5.75% drop in IBM shares as the computer services ($DJUSDV) industry was slammed on Tuesday.
Pre-Market Action
U.S. futures are higher this morning as the NASDAQ attempts to recover its out sized losses from Tuesday. Biogen (BIIB) will help the biotech group rebound from weak action yesterday as this biotech giant was able to beat Wall Street consensus estimates. Despite a $16 pop currently in BIIB, it will have lots of technical work to do in the days ahead to clear moving average, trendline and price resistance.
Boeing (BA) also looks to lift the aerospace group ($DJUSAS) as they reported blowout earnings. This comes just one day after United Technologies (UTX) provided an earnings-related lift to the group. Finally, General Motors (GM) is looking to fuel a rise in autos ($DJUSAU) after posting excellent earnings as well. Sirius Satellite (SIRI) also appears poised to rally with autos as they are at the cusp of a major price resistance area close to 4.00-4.05. Volume expanded on SIRI on Tuesday so keep an eye out for a further move higher here.
Current Outlook
Given the strong futures this morning, we'll likely see 20 week EMA resistance levels challenged once again today. Currently, the Dow Jones and S&P 500 both are slightly above their respective 20 week EMAs, but the S&P 500 in particular is at a key price resistance level from 2040-2045. Today I want to focus on a longer-term chart of the NASDAQ to illustrate the longer-term battle that's taking place. The rally off the August lows is important for a couple reasons. First, buyers returned before major intermediate-term price support at 4250 was lost. Second, volume has not been light on the recovery. But now that we've seen this nice recovery, can we clear areas of resistance that generally are not cleared during a bear market - namely, price resistance (near 4910) and that falling 20 week EMA (currently 4883). All of this action is taking place within a very bullish long-term up channel. Take a look:
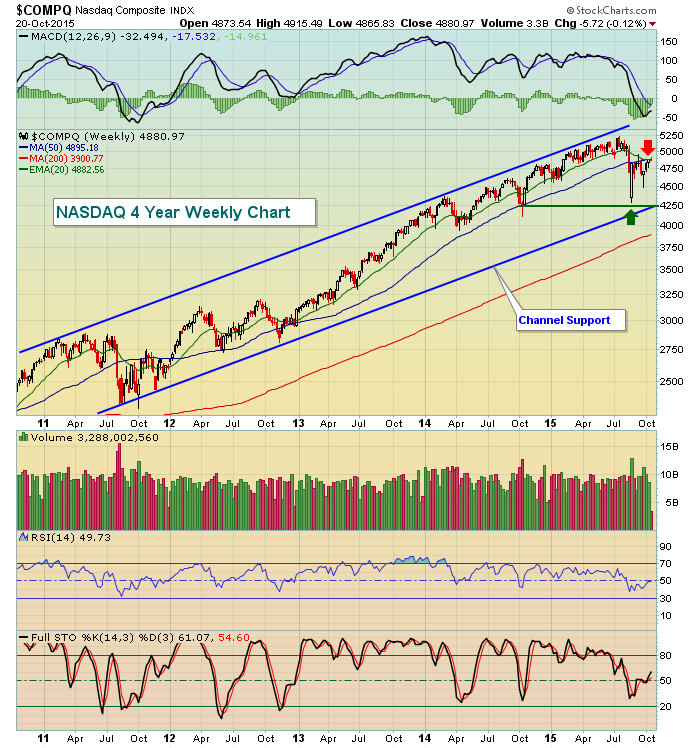
We grow so accustomed to little weakness during raging bull markets that we lose perspective. Corrections do happen during bull markets. It doesn't seem that way because we hadn't seen one since 2012. Believe it or not, NASDAQ 4250 is MAJOR support in this continuing 6 1/2 year bull market. After testing that level in August (green price support line above), we've managed to rally all the way back to key resistance, where we now have a battle. A break above both price resistance and moving average resistance (red arrow) would argue the worst is behind us and I'll expect to resume the bull market. Failure here though opens up more potentially bearish scenarios.
Sector/Industry Watch
While the IBM earnings report no doubt hurt the computer services ($DJUSDV) group, the technical picture isn't totally lost. The DJUSDV fell significantly on Tuesday and did fail to hold onto key moving average support but recent price lows are still holding. IBM's future performance will certainly be a major factor in the overall group, but currently there is hope that price support will hold. Check out the chart:
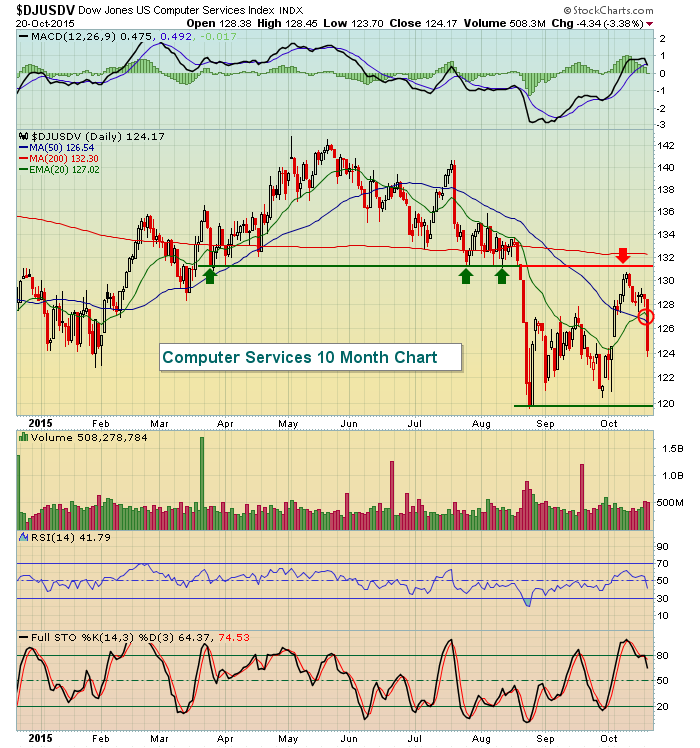
The green arrows above marked solid support near the 131 level, but once that failed to hold it became solid resistance (red arrow). We were already beginning to trend lower again PRIOR to IBM's earnings. The red circle shows the technical damage inflicted on the entire industry group by IBM's slashed guidance as both 20 day EMA and 50 day SMA support were violated on the close. The next key support will be found close to 120 and I expect we'll see it tested given the fact that IBM closed at a fresh low yesterday on heavy volume.
Historical Tendencies
From today's close through next Tuesday's (October 27th) close, the following represents the annualized returns for each of our major indices historically:
S&P 500 (since 1950): -45.19%
NASDAQ (since 1971): -75.79%
Russell 2000 (since 1988): -47.19%
While the historical tendency strongly favors the bears, this is by no means a guarantee and we've seen plenty of years where prices rise during this period. I use this historical information as merely another tool in trading, I don't rely on it exclusively.
Key Earnings Reports
(actual vs. estimate)
BA: 2.52 vs. 2.22
BIIB: 4.48 vs. 3.83
GM: 1.50 vs. 1.15
KO: .51 vs. .50
(reporting after the closing bell today):
AXP: 1.31 (estimate)
CTXS: .67 (estimate)
EBAY: .33 (estimate)
TXN: .67 (estimate)
Key Economic Reports
None
Happy trading!
Tom


