Market Recap for Monday, October 12, 2015
It was a relatively quiet session as many market participants shied away from action in observance of Columbus Day. NASDAQ volume was only 1.33 billion shares, extremely light compared to recent sessions. Still, the bulls managed to remain in control of the action with all of our major indices finishing higher for the day - with the lone exception the Russell 2000, which finished down by less than one point. Utilities were the leading sector, followed by consumer discretionary. Surprisingly, a $67 billion deal wasn't enough to spur technology to outsized gains. Dell Inc. announced an acquisition of EMC Corp of $33.15 per share, including more than $24 of it in cash. EMC closed at 28.35 - not exactly a ringing endorsement of the deal. Part of the deal included shareholders of EMC receiving a tracking stock of VMware (VMW). Apparently, traders didn't like the ramifications there, however, as VMW finished lower by 8%, tumbling to a two year low.
The strength in utilities to lead a market advance is never a good thing. Utilities generally lead when treasuries are in favor. Both are considered defensive in nature and are hedges. When they lead, it's due to the belief that our economy is likely to struggle, which in turn is bad for overall equity performance, namely the S&P 500. Despite consumer discretionary also performing well on Monday, their relative strength vs. consumer staples hasn't been great throughout this recent recovery. The following chart shows clearly that utilities, while cooling off recently, have been a relative leader throughout much of the stock market's recovery during September and October and that we need to see more strength from consumer discretionary:
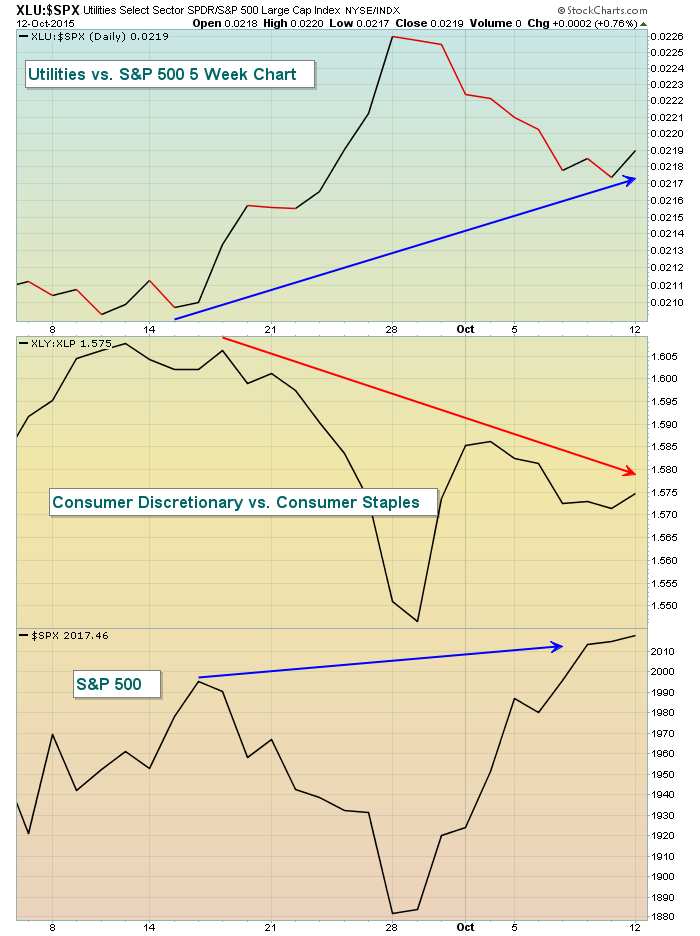
The S&P 500 has advanced strongly since late September - more than 7% - to forge to five week highs. But utilities are leading the advance while money in consumer stocks rotates from discretionary to staples. This is not great action, not the kind I'd look for to lead us out of this correction. In fact, industrials are the only aggressive sector to break to new highs relative to the S&P 500 during this rally. We need to continue to watch this.
Pre-Market Action
European indices are lower this morning and that weakness is carrying over to the U.S. London, France and Germany markets are all down from 1.0% to 1.6% at last check and that has sent U.S. futures down by roughly 0.5% to 0.7%, depending on the index. Twitter (TWTR) announced this morning that they will be laying off more than 300 employees, or 8% of its work force. In pre-market trading, TWTR is up by more than 3% on the news. Johnson & Johnson (JNJ) reported better than expected EPS, but on lighter than expected revenue. The stock was down 1.7% at last check in pre-market action.
The 10 year treasury yield ($TNX) is under pressure once again as traders move more defensively this morning. The TNX is down 4 basis points to yield 2.05%. A drop back beneath the 1.98%-2.00% area would likely spell trouble for U.S. equities.
Current Outlook
Despite money rotating into areas not exactly conducive to the resumption of a bull market, the Volatility Index ($VIX) continues falling and is approaching levels rarely seen during bear markets. Bear markets thrive on fear and impulsive selling. The former is dropping rapidly and the latter hasn't been seen much the past few weeks. We're not out of the woods as those weekly charts will certainly remind us, but I wanted to take a few minutes to show you how the VIX typically performs during bear markets. Let's first start with the 2000-2002 bear market. Take a look at this chart:
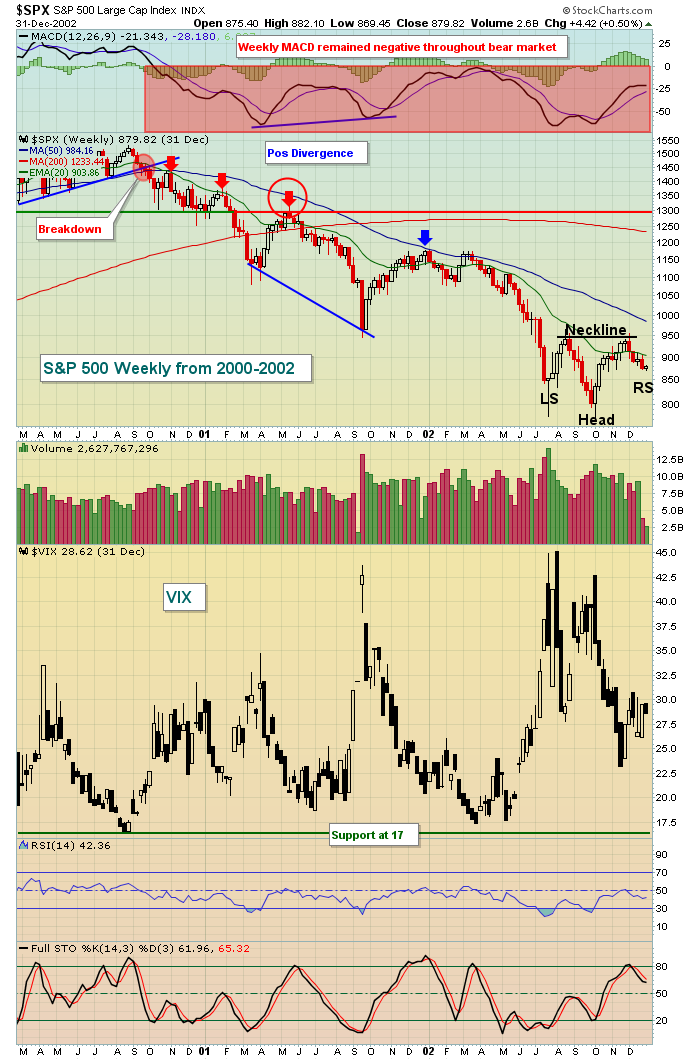
Here are the key points to take away from the 2000-2002 bear market:
1. The weekly MACD never crossed into positive territory during the bear market.
2. The VIX NEVER dropped below 17.
3. Once the breakdown in September occurred, the red arrows mark failed rally attempts at 20 week EMAs.
4. The circled red arrow shows a break above the 20 week EMA temporarily, but price resistance was never cleared.
5. A more extended rally occurred ONLY after a positive divergence printed.
6. The bear market ended with a bottoming reverse head & shoulders pattern
Now let's move on to the 2007-2009 bear market. Check this one out:
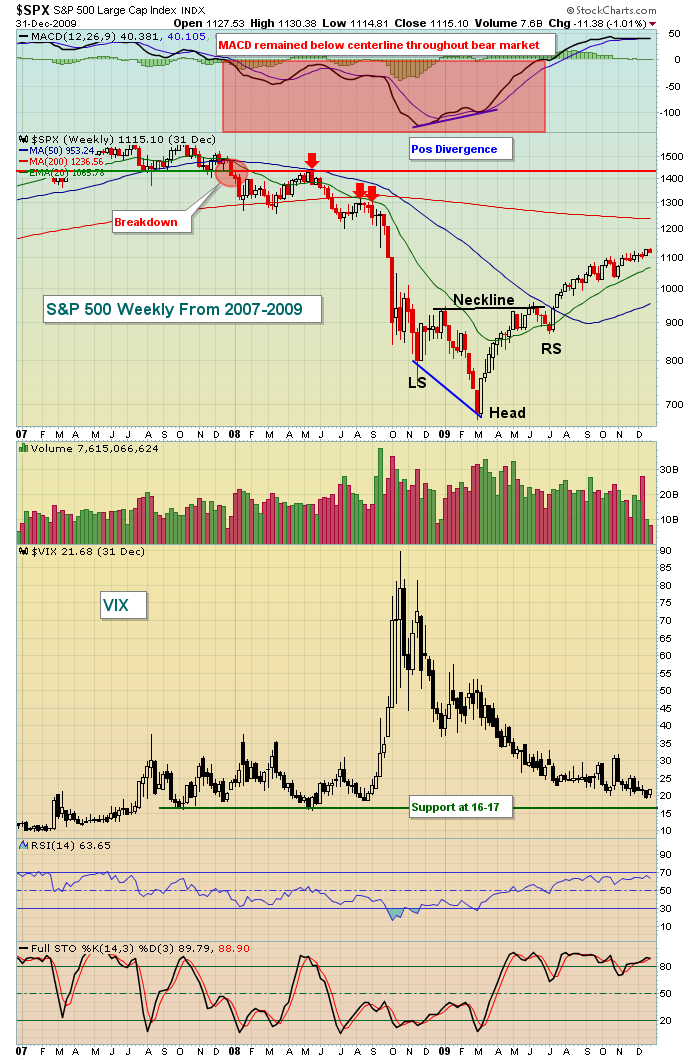
Here are the highlights:
1. Again, the weekly MACD stayed in negative territory throughout the bear market, no exceptions.
2. The VIX once again consistently held 16-17 support area.
3. Once the breakdown occurred, the red arrows mark 20 day EMA resistance, except for the price resistance test in May 2008.
4. An extended rally only occurred after a positive divergence printed.
5. The bear market ended with a bottoming reverse head & shoulders pattern.
The similarities are somewhat striking, aren't they? Now let's fast forward to where the S&P 500 currently resides using the same chart features:
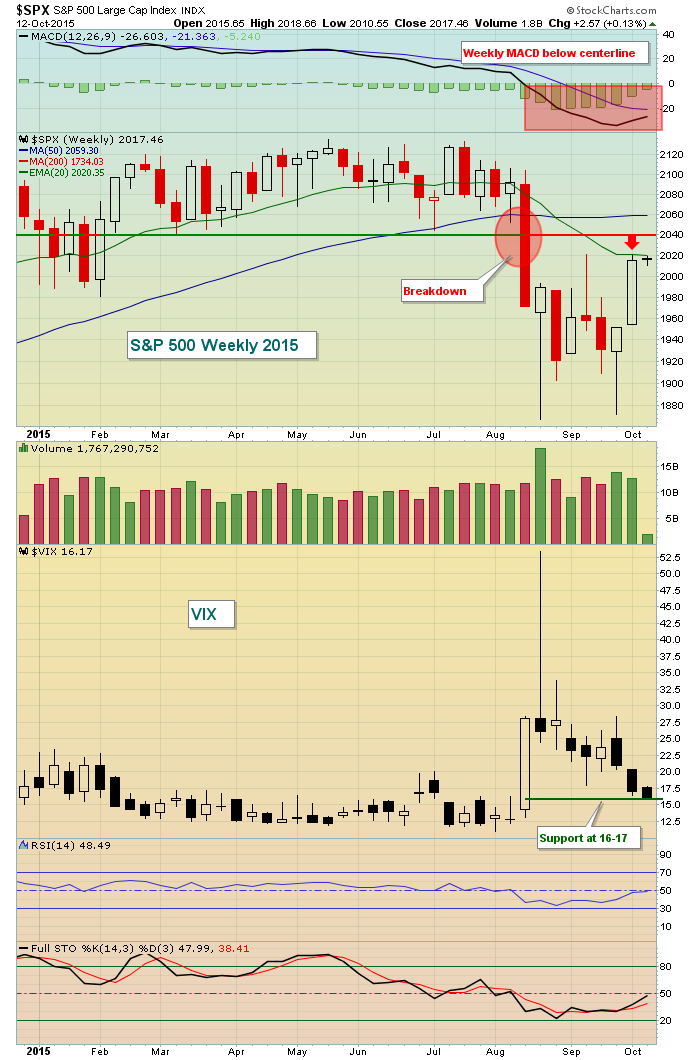
The similarities to the last two bear markets are scary. While this rally is nice, it would be much better to see the S&P 500 clear the 2040-2045 level. By doing so, it would be above both 20 week EMA and price resistance, something that was never done during the prior two bear markets. We'll see, right?
Sector/Industry Watch
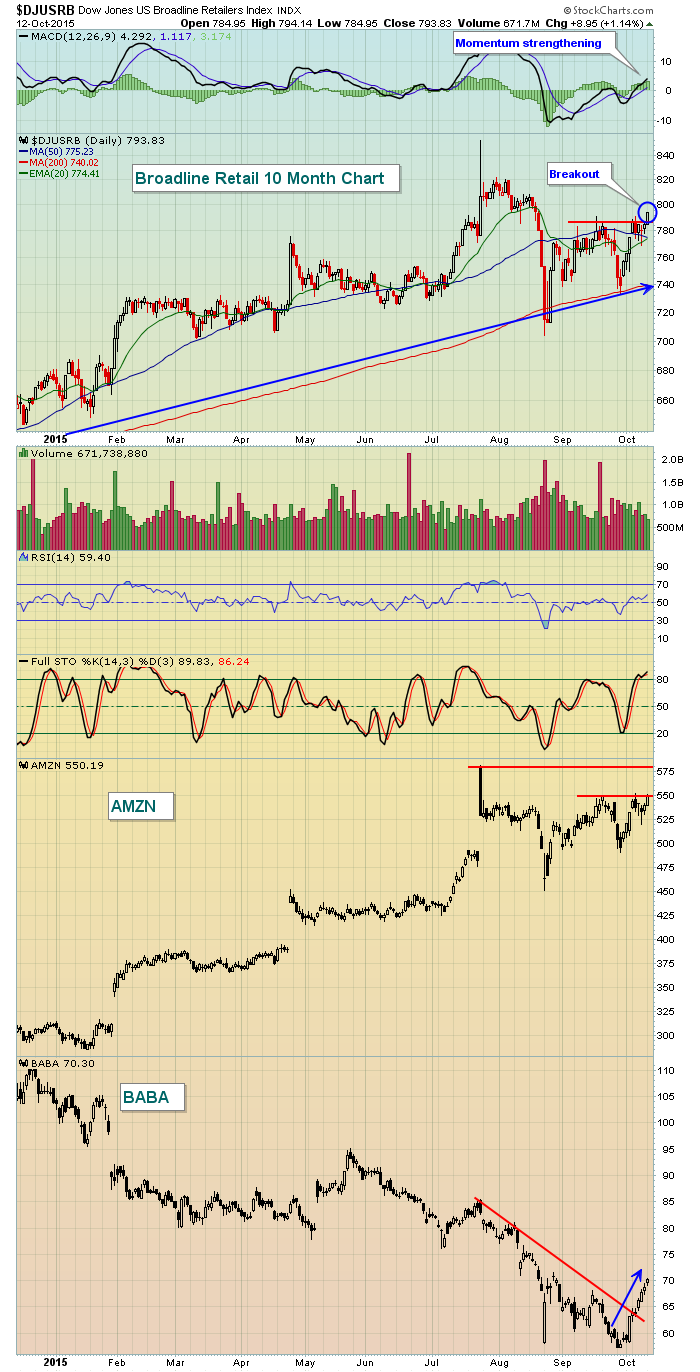
Broadline retailers ($DJUSRB) broke to a six week high on Monday, led by names such as Amazon (AMZN) and Alibaba (BABA). This is a group poised to perform well throughout the fourth quarter, particularly if the current market weakness turns out to be nothing more than a temporary correction. Here's the chart:
Historical Tendencies
The annualized returns for the S&P 500 for the balance of this week:
October 13 (Tuesday): +72.42%
October 14 (Wednesday): +13.70%
October 15 (Thursday): -24.58%
October 16 (Friday): -25.30%
Key Earnings Reports
JNJ: $1.49 (actual) vs. $1.44 (estimate)
CSX: $.50 (estimate)
INTC: $.59 (estimate)
JPM: $1.38 (estimate)
CSX, INTC and JPM all report after the closing bell today.
Key Economic Reports
None
Do me a favor please. Let me know what you think about the content of this blog report in the comments section below. Is there anything in particular that you'd like to see covered here that isn't? Also, be sure to click on the "Yes" button below and provide your email address. Then all of my articles will be sent directly to your email as soon as they're published. Finally, be sure to join me for my Trading Places LIVE webinars that are held on Mondays, Wednesdays and Fridays at Noon EST. You can register for my next webinar tomorrow by CLICKING HERE.
Thanks and happy trading!
Tom
