Market Recap for Tuesday, October 13, 2015
One piece of good news on Tuesday was that technology was the leading sector. However, all nine sectors moved lower and the action was probably the most bearish over the past 2-3 weeks. Serious short-term technical ramifications quickly surfaced. In no particular order:
1. The S&P 500 turned lower after testing the post-FOMC announcement high from September 17th. In other words, price resistance held.
2. The NASDAQ finished on its low after attempting to clear its 50 day SMA for consecutive days for the first time since late July, also turning lower at trendline resistance.
3. The Russell 2000 led to the downside in a big way - a common theme during recent heavy selloffs in U.S. equities.
4. Transports relative to utilities arguably had their worst day since the heavy August selling.
5. Since September 29th, the S&P 500 had risen from 1pm EST to 4pm EST over the past nine trading sessions. That ended yesterday with selling throughout the afternoon.
I could go on and on, but those are five quick takeaways from yesterday's bearish action. On an intraday chart, the S&P 500 bulls will likely see their first short-term test just below the 2000 level as shown below:
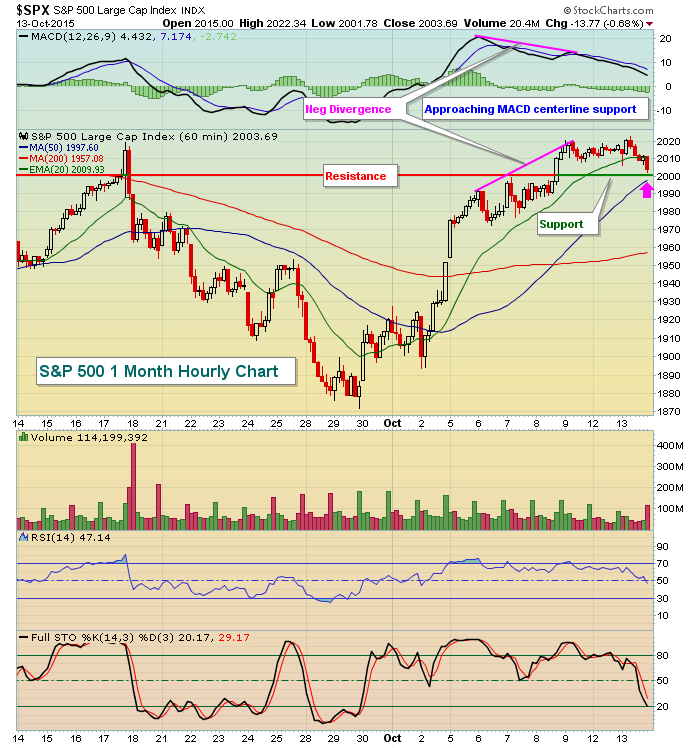
Recently, I discussed 60 minute negative divergences. These tell us that momentum appears to be slowing in the near-term and I generally look for 1-3 days of consolidation or selling to send the MACD back to centerline support and to potentially see a 50 period SMA test (pink arrow). On the chart above, you can see that the selling has not yet cleared price support close to 2000, nor has the MACD lost centerline support. Therefore, in the short-term, the bulls do maintain the upper hand and a reversal from the 2000 level should be viewed bullishly - so long as it holds. The afternoon selling on Tuesday does raise a red flag, however, and further selling below the aforementioned support would confirm that a near-term top is in. Keep in mind that we're approaching THE most bearish week of the year historically. It starts mid-week next week with more information below under "Historical Tendencies".
Pre-Market Action
U.S. futures were lower overnight, but have since turned positive. Economic reports just released appear to have come up short. PPI was much weaker than expected while retail sales were mostly in line, although the prior month was revised a bit lower. European markets were lower overnight, but have strengthened in the past hour or so and that's adding some strength to our pre-market action here.
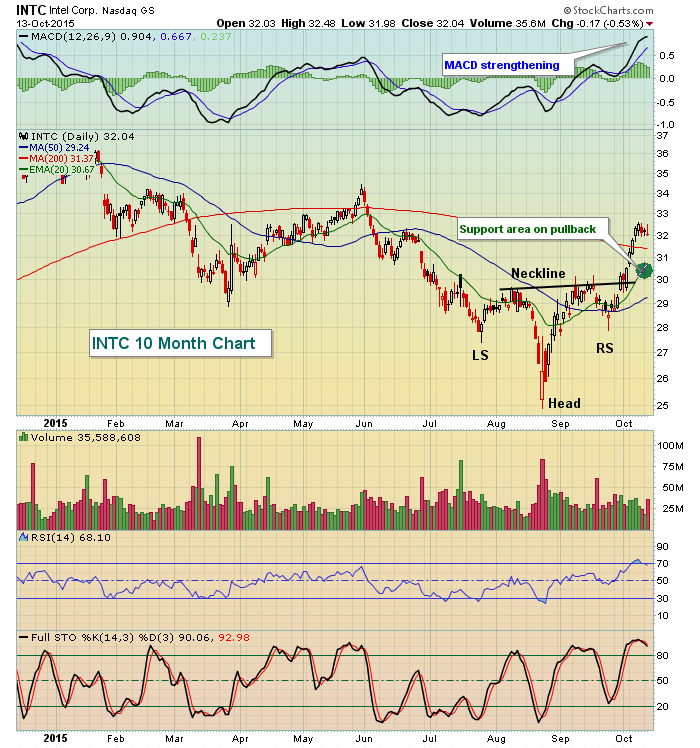
Intel (INTC) reported top and bottom lines last night that beat Wall Street consensus estimates. INTC traded mostly lower in the after hours session last night. While it's rebounded a bit this morning, it does still remain lower by 2% or so. Here's a chart with the current technical outlook:
Current Outlook
In yesterday's blog article, "What Makes A Bear Market" I pointed out how the long-term weekly charts provided clues during each of the two bear markets this century. Thus far, in terms of price action on our major indices, everything is setting up nearly identical to those prior two periods. It doesn't mean we're IN a bear market, but if you're bullish you should at least acknowledge the possibility and be watching for further clues. Below is another quick look at the S&P 500's weekly chart to illustrate how yesterday's action COULD be providing the short-term reversal that sets up the longer-term reversal lower again. Check this out:
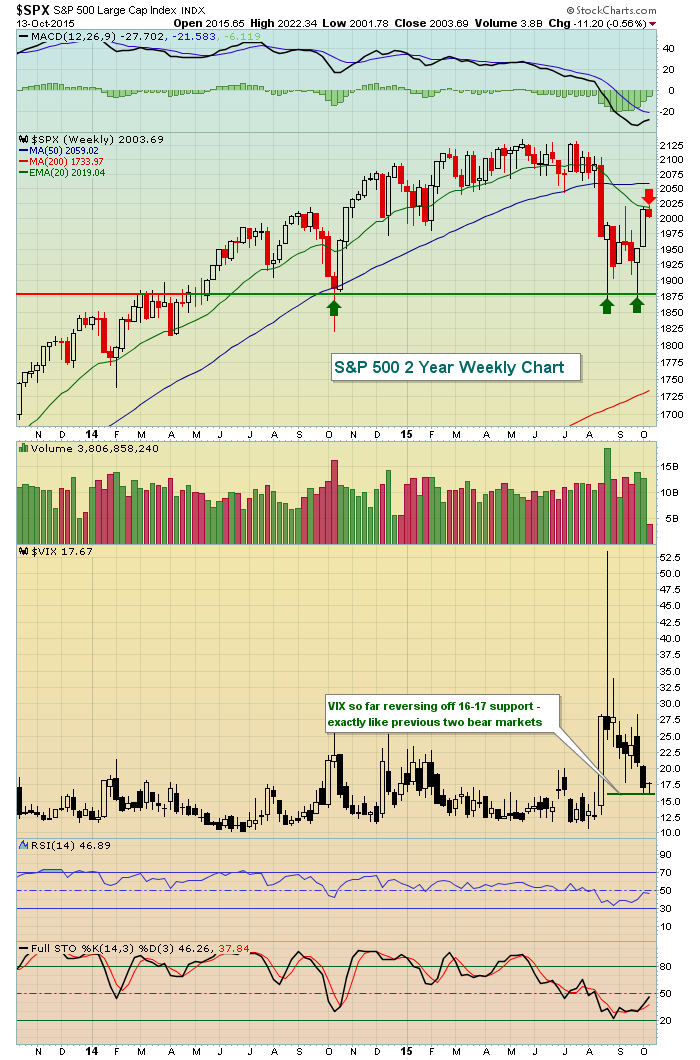
Failure at the falling 20 week EMA would be a bearish sign for sure. Remember this is a WEEKLY chart so the current week's candle isn't complete until Friday. Still, it certainly appears somewhat ominous at this point. Sirens, whistles and bells are going off in my head as I look at this chart and unless we see a big recovery into the end of the week, I'd remain EXTREMELY cautious. The signs of a potential bear market are there, so until the likelihood lessens, we should pay attention. It didn't help to see the Volatility Index ($VIX) bounce yesterday from the 16 level as that was the key support area throughout both prior bear markets as well. Careful please.
Sector/Industry Watch
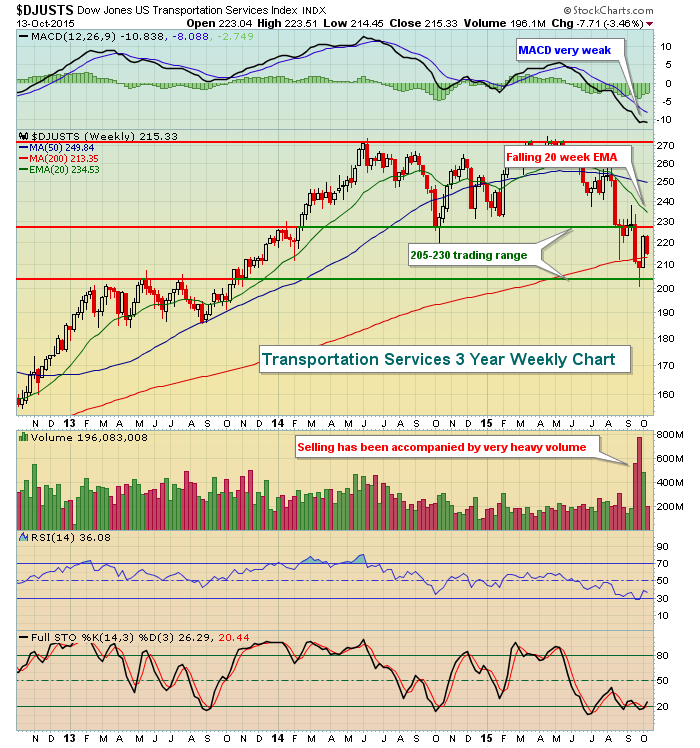
Over the past week, industrials have come to life and have led all other sectors in terms of relative strength. Transportation services ($DJUSTS) have participated slightly in this recent strength, but are reeling over the past three and six month time frames. On a weekly chart, the DJUSTS shows that sellilng momentum is strengthening as it attempts to hold onto critical price support. Take a look:
Historical Tendencies
The upcoming bearish period starts at the close next Wednesday and has an annualized return on the S&P 500 of -45.19% since 1950.
Key Earnings Reports
BAC: $.37 (actual) vs. $.33 (estimate)
DAL: $1.74 (actual) vs. $1.71 (estimate)
WFC: $1.05 (actual) vs. $1.04 (estimate)
NFLX: $.07 (estimate) - reports after the closing bell today
Key Economic Reports
September PPI released at 8:30am EST: -0.5% (actual) vs. -0.2% (estimate)
September Core PPI released at 8:30am EST: -0.3% (actual) vs. +0.1% (estimate)
September retail sales released at 8:30am EST: +0.1% (actual) vs. +0.1% (estimate)
September retail sales (ex-auto) released at 8:30am EST: -0.3% (actual) vs. -0.1% (estimate)
August business inventories to be released at 10:00am EST: +0.0% (estimate)
Happy trading!
Tom


