Market Recap for Tuesday, November 3, 2015
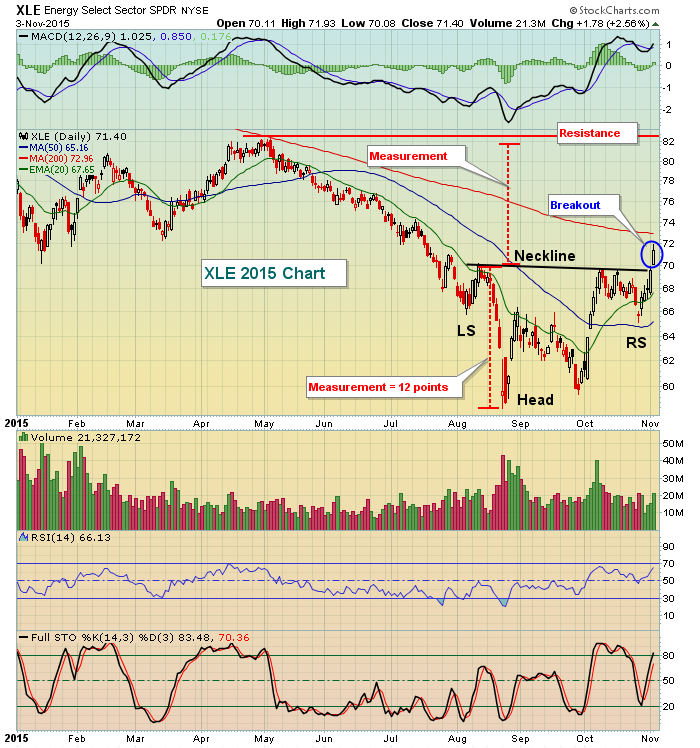
Energy (XLE) surged 2.56% on Tuesday, fueling yet another market rally to spur the S&P 500 to 2110, just 1% beneath its all-time closing high of 2130.82 set on May 21, 2015. Since setting reverse right shoulder support at 65.11, the XLE has risen 10.47% to establish its recent intraday high of 71.93 (Tuesday's high). For comparative purposes, the S&P 500 has risen 2.80% during the same period. Clearly, energy has regained its mojo and the breakout of its bottoming reverse head & shoulders pattern suggests we'll see more strength ahead. For more on potential targets on the XLE, check out the Sector/Industry Watch section below.
Seven of the nine sectors were higher on Tuesday, although energy was by far the best performer. The good news, however, is that the only two sectors to fall were healthcare and consumer staples, two defensive groups. Technology, on the other hand, displayed relative strength once again, trailing only energy in terms of its Tuesday performance. Computer hardware ($DJUSCR) and software ($DJUSSW) were the two primary drivers behind technology's rally with the former showing much more bullish technical action of late. The DJUSCR is home to Apple (AAPL) and is supporting a further rise as reflected on the chart below:
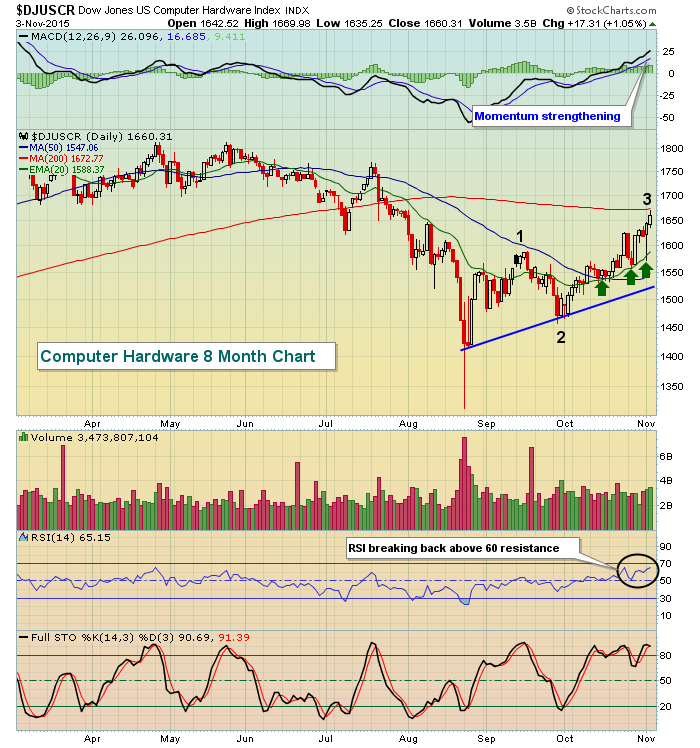
Computer hardware has been slower to recover than many areas of the market, but the technical improvement here is obvious. The MACD has made a bullish centerline crossover and recent selloffs have held at rising 20 day EMA support. This is bull market behavior. In addition, during extended downtrends, the RSI 50-60 zone typically marks tops during countertrend rallies. We're seeing the RSI move back above 60 for the second time in the past two weeks - not bear market behavior. The recent higher high and higher low is marked with 1-2-3. It's the first time we've seen this short-term pattern since the May high and subsequent decline. It could be more of an intermediate-term rally, but with overall market conditions pointing to a continuing rally within a 6 1/2 year bull market, I'd give the benefit of the doubt to the hardware bulls and expect further strength ahead.
Pre-Market Action
The ADP employment report came in about as expected this morning as U.S. futures look to extend recent gains. Facebook (FB) will be reporting after today's closing bell, but most internet stocks have been reporting solid results and the fourth quarter is generally kind to the group. The biggest risk of holding FB into its earnings report is the fact that the stock has risen 20% in the past five weeks. Traders are building in excellent results into the current price. Therefore, FB is likely going to need a blowout report to see additional short-term gains. It's quite possible, just recognize the growing risk because of expected great results.
Strong action overseas will help to provide tailwinds as well. Asian markets were significantly higher overnight while Europe trades mostly higher as well.
Current Outlook
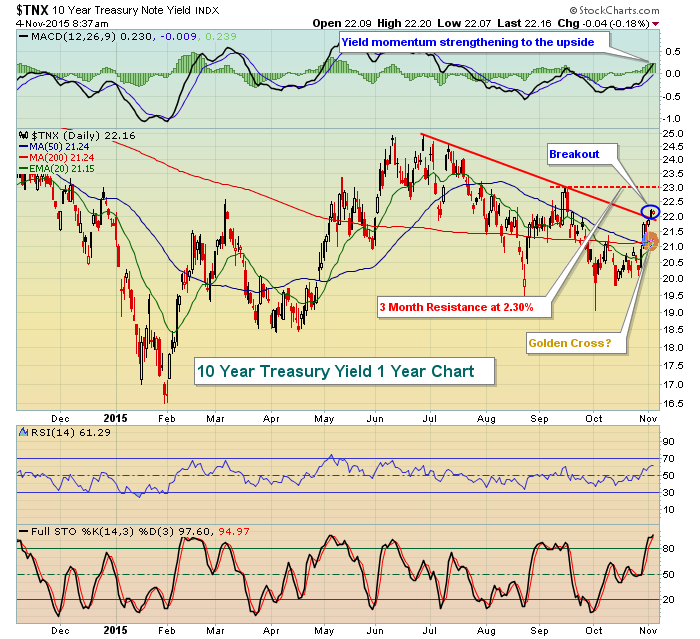
The technical conditions have improved greatly over the past several weeks. Key (bear market) resistance levels have been cleared on most of our sector and industry group charts. And sector and industry group rotation is favoring the bulls as well. The 10 year treasury yield ($TNX) is trending higher and the selling of treasuries is helping to fuel the stock market's rise. We're closing in on a golden cross on the TNX, which would follow the bullish MACD centerline crossover that we saw late last week. Should the 20 day EMA continue to push higher and cross above the 50 day SMA, it would represent the first time since late July. We saw momentum on the yield decline in late July and that of course preceded the nasty correction in August. Here's the current chart on the TNX:
While consumer stocks have been lagging of late, it doesn't mean we shouldn't pay attention to how the discretionary group (aggressive) is relating to the staples group (defensive). A rising ratio between the two is quite bullish because it suggests that traders believe in the theory of strong or improving economic activity ahead. Breakouts in this ratio generally coincide with bull markets. Despite the lagging consumer stocks as a whole of late, the ratio between the two have been widening in very bullish fashion. Over the past week, consumer discretionary (XLY) has advanced 2.31% (middle of the pack in terms of sector performance) while consumer staples (XLP) is being abandoned, dropping 1.52%. That's resulted in a surge in the XLY:XLP ratio as this indicator made a very important closing breakout. It's difficult to see the breakout on a candle chart, but on a line chart (which connects only closing prices) the breakout is clear. Check it out:
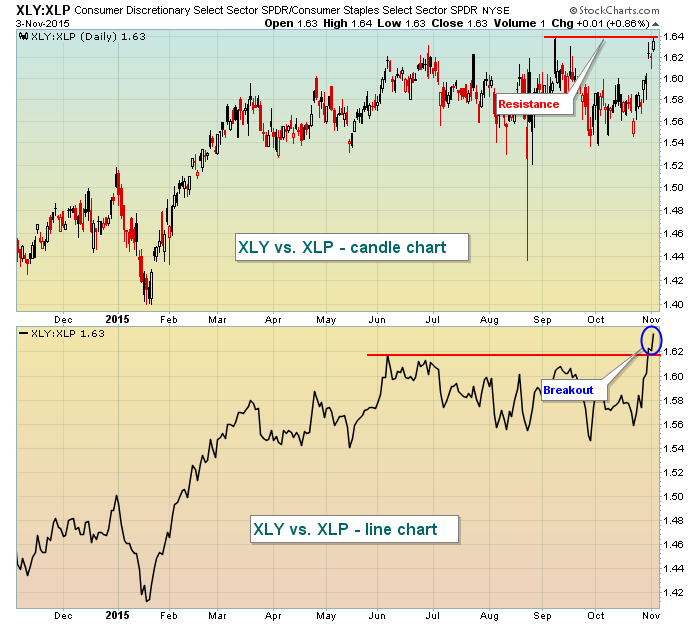
In my opinion, this is a POWERFUL statement being sent by the market. As I always say, nothing is a guarantee, but you have to wonder why discretionary stocks would be breaking out to an all-time high over staples stocks - unless we're staring at economic improvement ahead.
Sector/Industry Watch
I focused on energy in this section yesterday and I'm going to add to it today. The neckline of the current reverse head & shoulders pattern on the 2015 chart was cleared during Tuesday's rally and that sets up for a potential measurement to roughly 82.00. This 82.00 level is important on the weekly chart as well. Check out the daily chart below for recognition and measurement and then see how this plays out on the weekly chart. Interesting.
The measurement of this breakout nears resistance, interesting in itself. But on the longer-term weekly chart, this measurement could be setting up a very bullish inverse head & shoulders continuation pattern. Check out the possibility here:
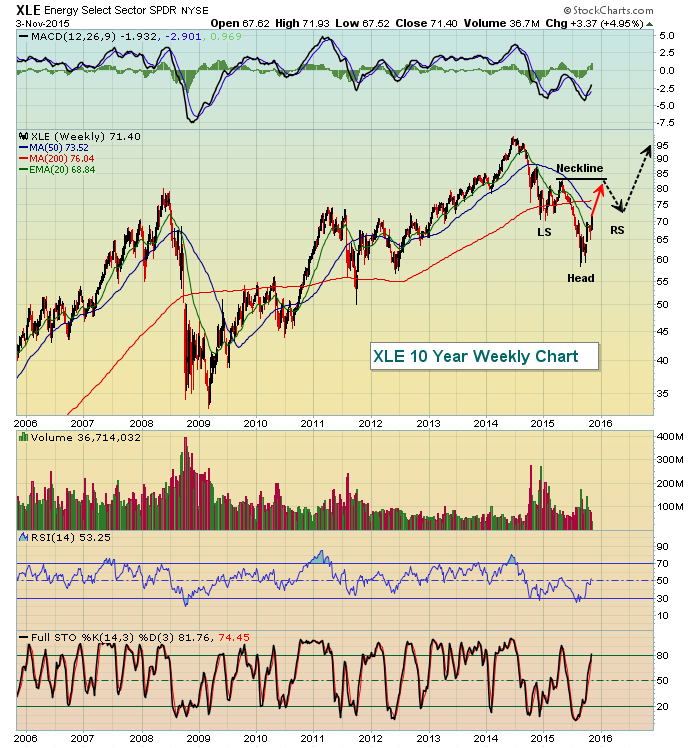
The red arrow simply marks the "measurement" from the reverse head & shoulders breakout reflected on the daily chart. The subsequent black dotted arrows mark the potential of what COULD occur on the long-term weekly chart. After an extended uptrend like the one we saw from 2009 to 2014, it's not unusual at all to see a continuation pattern develop. This does not provide any sort of guarantee of course, I'm just speculating as to the possible ramifications of yesterday's shorter-term breakout.
Historical Tendencies
While November is one of the best calendar months of the year to be long equities, there are periods in the month that tend to produce the best results and we're in one of them right now. This period of historical strength ends at Friday's close and we typically see a bit of profit taking over the subsequent few days. I'll provide details on what to look for in the second half of November early next week.
Key Earnings Reports
(actual vs estimate):
AGN: 3.48 vs 3.25
BDX: .94 vs .90
CDW: .68 vs .76
CHK: (.05) vs (.13)
CTSH: .67 vs .69
FOX: .38 vs .37
HSIC: 1.55 vs 1.46
KORS: 1.01 vs .89
TWX: 1.25 vs 1.09
WCG: 1.00 vs .95
(reports after the close today, estimate provided):
CSC: 1.15
FB: .35
FEYE: (.88)
MCHP: .57
MELI: .60
MET: 1.47
PRU: 2.44
QCOM: .71
RIG: .67
SLF: .66
WFM: .35
Key Economic Reports
October ADP employment report released at 8:15am EST: 182,000 (actual) vs 185,000 (estimate)
October PMI services index to be released at 9:45am EST: 54.8 (estimate)
October ISM non-manufacturing index to be released at 10:00am EST: 56.7 (estimate)
Happy trading!
Tom


