Market Recap for Monday, November 2, 2015
The action on Monday was mostly positive, especially as we look at the performance of our major indices. All were higher and relative strength was seen by the more aggressive Russell 2000 and NASDAQ. That's always a good thing. Energy and healthcare were the leading sectors and, in my opinion, these were the two biggest reasons the bull market stalled earlier in 2015. Energy was technically broken and found it difficult to find buyers while healthcare displayed negative divergences on the weekly charts of EVERY industry group within its space. Both seem to be rectified now as biotechs ($DJUSBT) resumed their strength gaining more than 3% yesterday.
Financials performed well, as I would expect with the 10 year treasury yield ($TNX) climbing. However, the strength within financials was strange. REITs were among the leaders and they typically perform poorly when treasury yields are rising. Meanwhile, banks ($DJUSBK) and life insurance ($DJUSIL) simply performed middle of the pack, also odd with yields rising as these two industry groups benefit from rising rates.
Throwing another monkey wrench into the mix were consumer stocks as neither discretionary nor staples stocks performed well on a relative basis. I'll be happy to give them a break, though, as both sectors recently broke out to fresh 2015 highs and look solid technically.
Pre-Market Action
While many of the biggest companies have reported quarterly results, a surge in second tier companies will be reporting this week. In fact, this is the heaviest week of earnings reports of the quarter. According to Zacks, over 1500 companies will be reporting this week alone. If you are holding stocks, please be sure to check earnings dates and make a conscious decision on whether you want to hold into these reports. For longer-term investors, it may not be an issue, but for short-term traders holding into earnings, risk grows immensely.
Taser (TASR) reported this morning and missed its EPS estimate, but beat on the top line. Technically, it's near a key long-term support area so how it reacts from this level is important. Check it out:
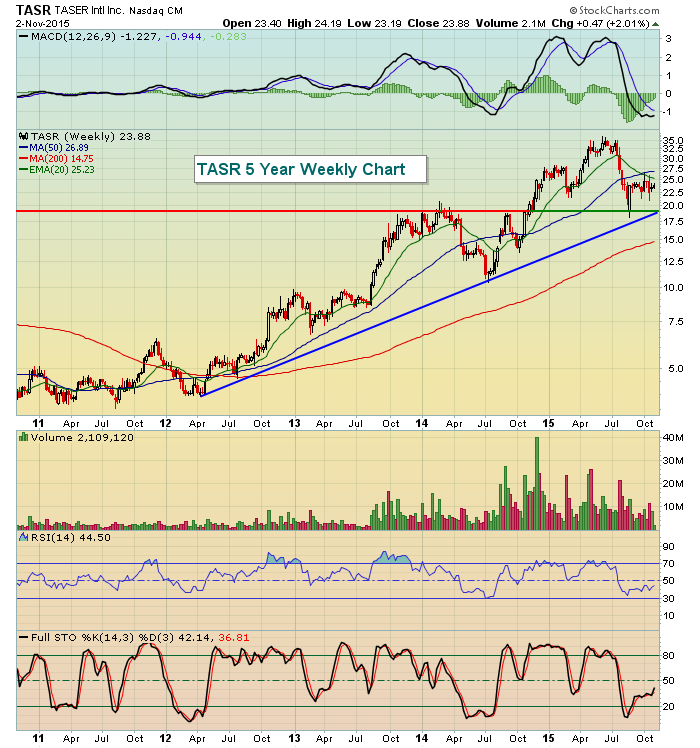
Price and trendline support both coincide just below the 20.00 level. Given the weaker than expected earnings, TASR could eventually challenge this critical area of support. We'll see.
U.S. futures are lower this morning as traders look to take profits after Monday's advance. European indices are down fractionally on the heels of Asian markets closing mixed. I'd watch key short-term support levels like the 20 hour EMA for clues about market direction. The bulls are definitely in charge in the near-term and short-term momentum is strong, especially on the Russell 2000.
Current Outlook
A little more than a week ago, our major indices were facing critical price and moving average resistance and we were entering the worst historical week of the calendar year. The cards were stacked against the bulls and the bears had a tremendous opportunity - and failed. Blame it on central bankers, blame it on earnings, blame it on whatever you want, but the point is that the opportunity was there and wasn't seized. Now the bears are facing technical strength and the most bullish historical three consecutive month period of the year. Odds favor a resumption of the 6 1/2 year bull market with money returning to sectors that also favor the sustainability of this advance. The S&P 500 is within an earshot of a fresh all-time high just a couple months removed from what many perceived was the start of our next bear market. Now all eyes are back on 2131, the closing high on the S&P 500 from May. Respect this resistance level until it's cleared.
It's important that we see wide participation on any breakout. In other words, it's important to continue the recent leadership from the Russell 2000 small cap index. Check out the relative strength returning to this aggressive index:
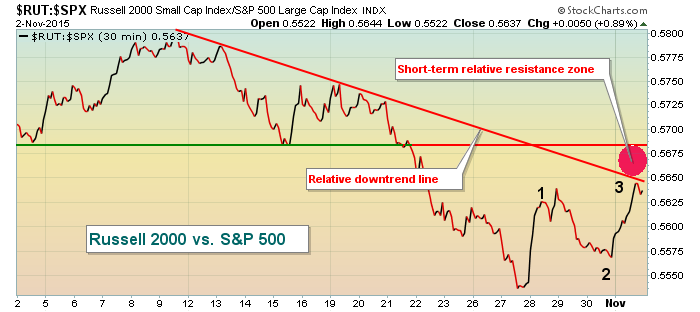
I'll be honest - the above relative performance isn't great, but the recent strength is a start. First of all, the 1-2-3 points reflect an uptrend established - a higher low and with yesterday's relative strength, a higher high. The small cap bulls are now up against a key relative resistance zone. I do have confidence this area will break because this renewed strength is coming off of key long-term relative support in the low to mid .550s. Here's a reprint of a recent chart I used to illustrate this relative support:
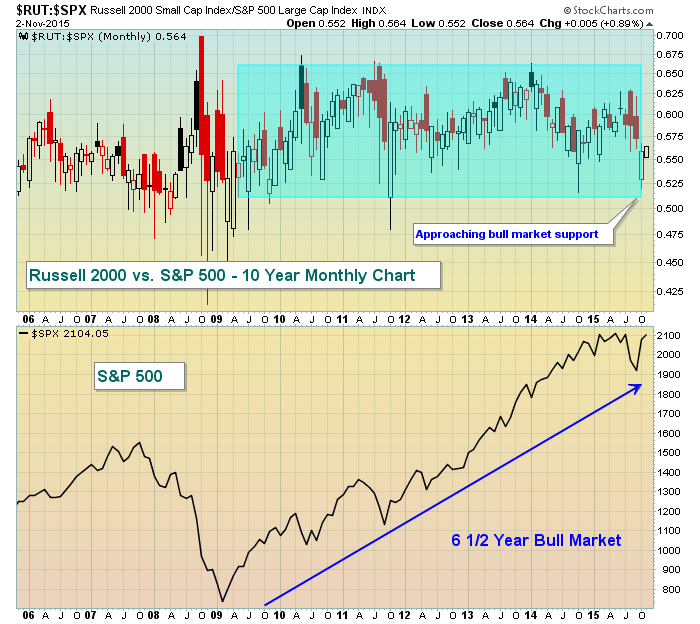
You can see from the above monthly chart that we don't visit that .550-.555 relative level very often and when we do, we bounce. I'm expecting a similar bounce now and that would support a continuing bull market.
Sector/Industry Watch
Earlier in 2015, we have technical issues. There were weekly negative divergences on many key indices, sectors and industry groups. In addition, we had VERY weak sectors in energy and materials. The combination of these two factors made it nearly impossible to continue the bull market without consolidation or a correction. It had been a few years since we had a correction so we can't be overly upset with the action this summer. Typically, that's the time of the year the market cools off. Conditions are different now though. Those weekly negative divergences have been rectified with the intense selling in August. Furthermore, both energy and materials have been relative leaders among sectors over both the last one week and one month periods. They're not the current technical drag on the market they were throughout the first half of 2015. In fact, energy is starting to look quite bullish as shown below:
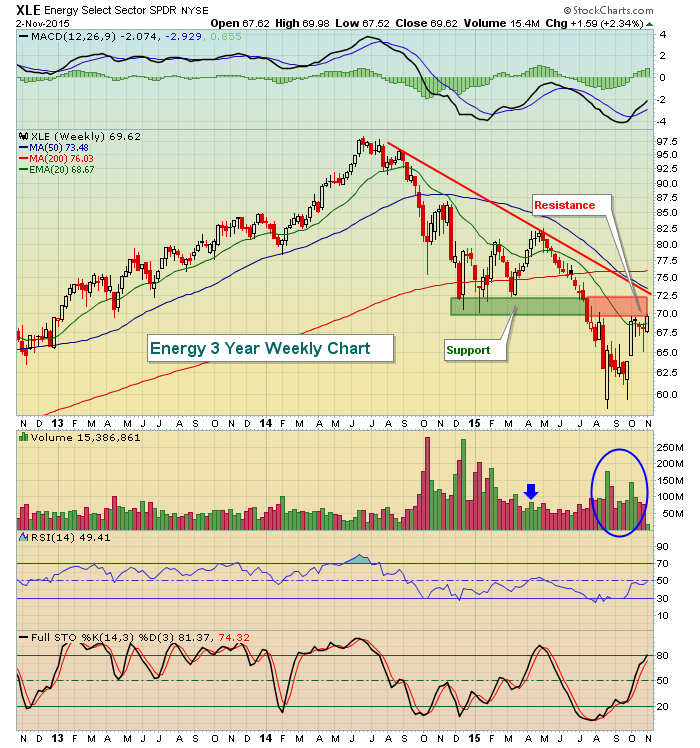
Similar to the RUT:SPX ratio shown earlier, this isn't perfect - but it's improving. During the last push higher in March and April, we saw very light volume (blue arrow) to support the advance and it quickly failed and energy turned lower again. This latest rally attempt has at least been supported by stronger volume (more interest). The bad news is that we've yet to clear significant price and trendline resistance in the 70.00-72.50 area. How the XLE reacts to this resistance zone will go a long way towards determining whether the S&P 500's rally will extend to fresh all-time highs beyond 2130.
Historical Tendencies
I've spoken on several occasions about the tendency of stocks to finish higher on their January 19th close vs. their prior October 27th close. This represents the most bullish consecutive (almost) three month period of the year. Here are the numbers on the NASDAQ to support this theory. Since 1971, the NASDAQ has been higher during this period 38 of 44 years. More recently, this period has finished higher 12 of the last 13 years. The years that didn't participate? 1974, 1982, 1990, 1996, 2001 and 2008.
Key Earnings Reports
(actual vs estimate):
ADM: .60 vs .71
ATVI: .18 vs .13
CIT: .26 vs .75
DISCA: .47 vs .39
EXPD: vs .59 (have not seen results yet)
HRS: 1.31 vs 1.28
K: .85 vs .83
ODP: .16 vs .17
RRGB: .58 vs .53
S: (.13) vs (.09)
TASR: .03 vs .08
VMC: .95 vs .95
(reports after today's closing bell, estimate provided):
CBS: .81
DVN: .57
JCOM: .78
TSLA: (.71)
X: (.28)
Key Economic Reports
September factory orders will be released at 10:00am EST: -0.9% (estimate)
Happy trading!
Tom


