Market Recap for Monday, November 16, 2015
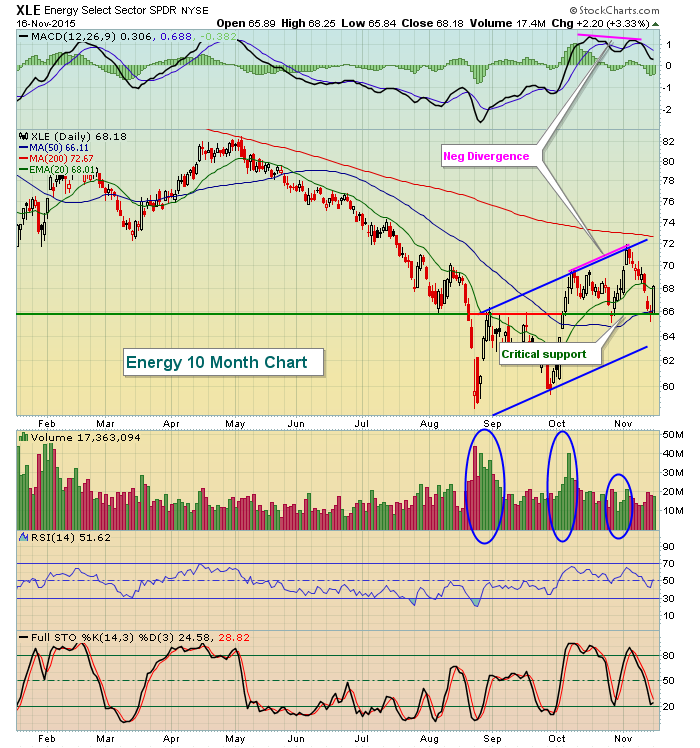
All nine sectors moved higher on Monday and the wide participation was evident in the 1%+ gains across the board. Leadership in energy (XLE) was clear with that sector's 3.33% advance off key support near 66.00. This level was critically important technically as you can see from this reprinted chart that I provided last Wednesday:
After pointing out the negative divergence, it was suggested that we'd see a 50 day SMA test and a possible MACD reset at centerline support. 66.00 has been a pivotal level of both resistance and support over the past 3-4 months so bouncing off this level should provide the bulls comfort. Now that we've seen another key save at 66.00 support, the strength of that support grows and should be respected on any subsequent decline.
Retailers were extemely weak last week so I've been watching the industry groups in this space very closely. Specialty retailers ($DJUSRS) gained a very respectable 2.64% on Monday and while they've come under fire on their daily chart, this was to be expected somewhat based on weekly slowing momentum. I'm featuring this industry group in the Sector/Industry Watch section below today.
Pre-Market Action
U.S. futures are considerably higher this morning and there are a few factors at work here. First, retailers had been under fire and that's a significant component of the consumer discretionary group. However, fortunes in that group reversed on Monday and their renewed strength seems likely to continue on the heels of mostly better-than-expected earnings results today. Wal-Mart (WMT), Home Depot (HD) and TJX Companies (TJX) all are trading higher after reporting solid results. The only downer this morning came from Dick's Sporting Goods (DKS), which disappointed and is trading beneath long-term price support and down 16% in pre-market action. Second, we saw a major reversal in the VIX on Monday and lower expected volatility is almost always a bullish development. Third, CPI came in as expected this morning and bond traders are selling treasuries with the 10 year treasury yield ($TNX) back to 2.30%. That selling of treasuries produces proceeds available to support higher equity prices. Finally, global markets are higher and helping to lift spirits here in the U.S. Asian markets were mixed overnight, but European indices are staging a very strong rally with most key indices up by 2% or more.
Current Outlook
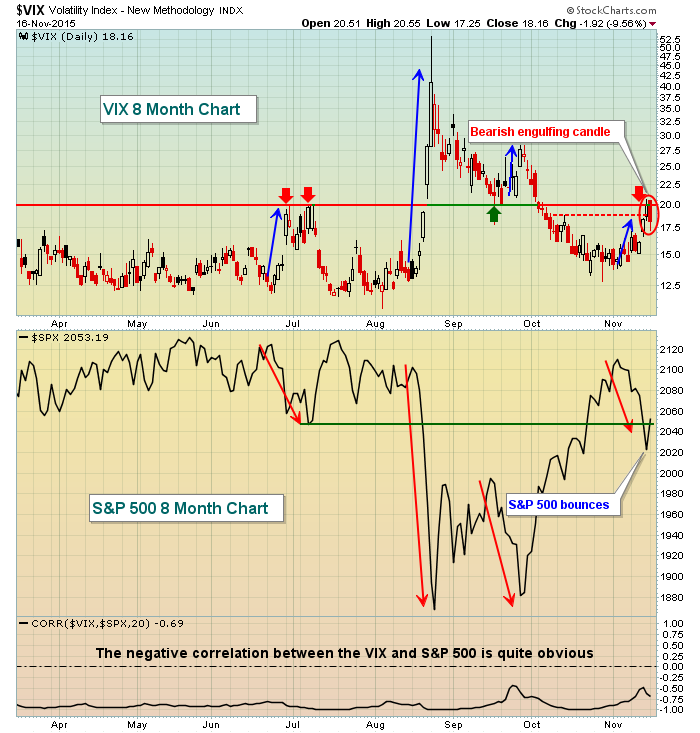
The bears were rebuffed at that key VIX level of 20 on Monday and we saw a huge reversing candle (bearish engulfing) by the close. That's important because it sends the message that the short-term spike in the VIX has ended and a downtrend is more likely than not to begin. A downtrending VIX is synonymous with a rising S&P 500. I'm always a fan of afternoon buying and we saw a bunch of that on Monday afternoon. From approximately 11:30am EST, we saw a trend day of unabated buying. That strength looks to resume today at the open based on U.S. futures. The bulls will be looking to add to their gains. The VIX will be very important to watch as impulsive selling tends to accompany a VIX that's above 20 and on the rise. We saw how quickly the market deteriorated in August. That doesn't happen when volatility is reined in. Here's the latest look at expected volatility where you can clearly see the short-term problem the bears face:
This is another reprinted chart from late last week. I simply added the "call out" boxes to highlight the bearish engulfing candle and the bounce in the S&P 500. We're likely to see much further deterioration today in the VIX unless the bears are able to step up after the open. Watch the action today in the final couple of hours. Off the recent selling, if we're going higher, there will likely be more market maker buying heading into the close. From a bearish perspective, you most definitely want to see another reversal today and whipsaw action with volatility soaring again by days' end.
Sector/Industry Watch
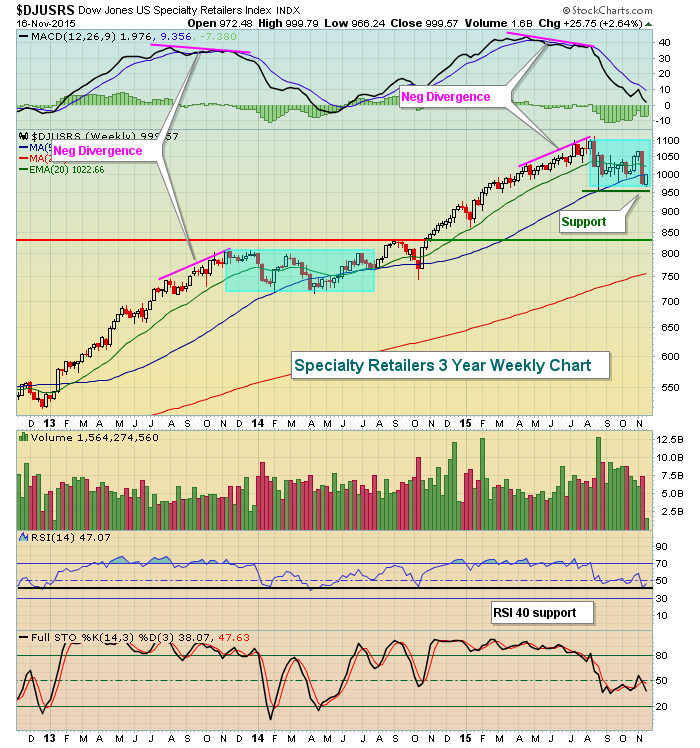
Let's take a look at specialty retailers ($DJUSRS). Consumer spending is a huge part of our GDP so it's always worthwhile to keep a close eye on consumer stocks - not just how they're performing on an absolute basis, but also how the discretionary area (XLY) is trading relative to its staples counterparts (XLP). While the XLY:XLP ratio dipped on Monday, the DJUSRS had a very important positive reaction to last week's selloff. Check this weekly chart out:
When a group rises in parabolic fashion, it sometimes needs a period of consolidation or rest and many times that consolidation will see its weekly RSI drop to the 40-50 zone. We saw consolidation with the DJUSRS after the massive rise in 2013. It printed a negative divergence and required a period of consolidation (blue shaded area) to "reset" its weekly MACD at its centerline. After that rise, it went virtually nowhere for close to a year as its RSI hovered at or above 40 support. As we fast forward to the 2015 advance, you can see the same type of momentum issue arise - and a similar reaction. The group simply ran too far too fast and needed relief, which is what we've seen the past 3-4 months. The point here is that negative divergences do not always mean long-term TOPS. Many times they suggest consolidation until the longer-term trend higher resumes. I would view this retail group to be consolidating in a longer-term uptrend until it fails to hold key support. For me, that would be the high VIX-driven price lows in the index set in August. A key component of this index is Netflix (NFLX), which also is consolidating after a huge advance. NFLX could hold the key to the group in general. NFLX rallied strongly on Monday.
Historical Tendencies
If our major indices can continue to perform well this week, which definitely favors the bears historically, seasonal tail winds will resume mostly through year end.
Key Earnings Reports
(actual vs. estimate):
DKS: .45 vs .46
HD: 1.36 vs 1.32
TJX: .86 vs .84
WMT: 1.03 vs .97
(reports after today's close, estimate provided):
JACK: .65
LZB: .41
Key Economic Reports
October CPI released at 8:30am EST: +0.2% (actual) vs. +0.2% (estimate)
October Core CPI released at 8:30am EST: +0.2% (actual) vs. +0.2% (estimate)
October industrial production to be released at 9:15am EST: +0.1% (estimate)
October capacity utilization to be released at 9:15am EST: 77.5% (estimate)
November housing market index to be released at 10:00am EST: 64 (estimate)
Happy trading!
Tom


