Market Recap for Friday, November 13, 2015
Retailers were slammed on Friday after October retail sales came up short of expectations. Retail sales for the month gained 0.1% while expectations were for a much stronger 0.3% rise. Excluding autos, retail sales rose 0.2%, one half of the anticipated 0.4% climb. That disappointing report combined with very weak quarterly earnings reports of late led just about everything retail related much, much lower. The five worst performing industry groups were retailers, including apparel retailers which were hit hardest of all, falling 5.65% on Friday and nearly 11% for the week. It was a very bearish weekly candle and a technical breakdown for sure. Have a look:
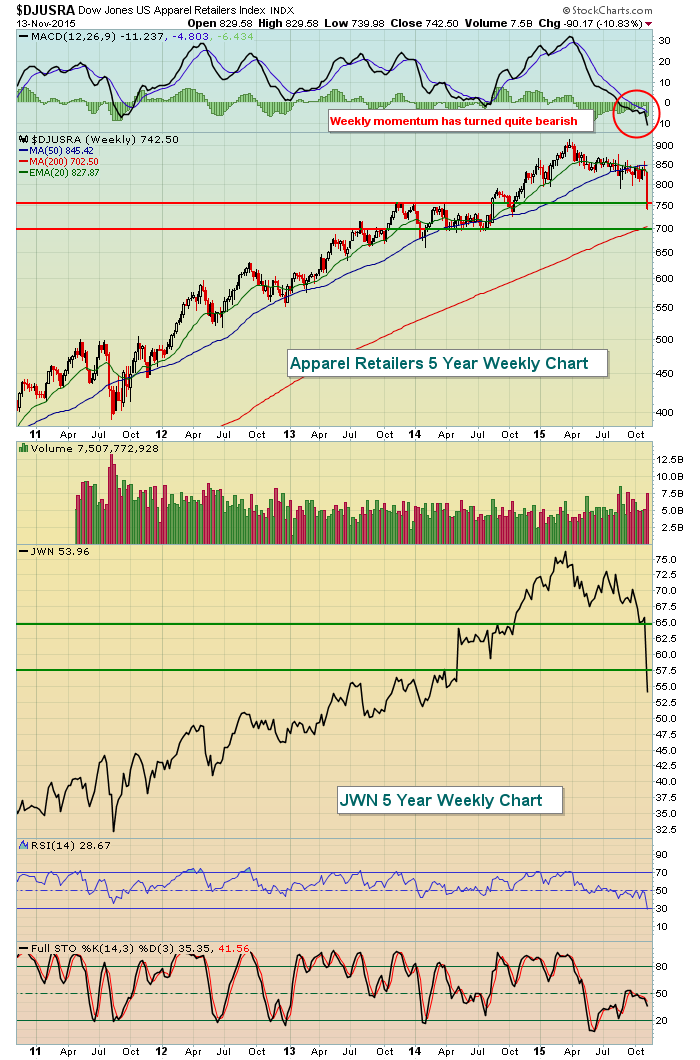
Clearly, retailers have some technical work to do. In fact, until key moving averages are cleared to the upside, I'd look at any bounce in the group as nothing more than that. Nordstroms (JWN) was the latest company in this space to report very disappointing earnings and guidance and that was taking its toll on all of retail last week. For the week, consumer discretionary (XLY) was able to beat out only energy (XLE) in terms of sector performance. The XLY fell 4.53% while the XLE dropped 5.47%. Technically, the latter was almost to be expected given its recent string of gains and the negative divergence that emerged on its most recent price high. Technically, retailers didn't provide us those advanced warning signals.
Pre-Market Action
Dillards is adding to an already very weak retail group this morning as they came up short on quarterly earnings and are down another 12% in pre-market action after falling 13-14% last week. This news is likely to put consumer discretionary right back on the hot seat at today's open. U.S. futures are down after spending part of the morning in positive territory, following the earlier lead from its European counterparts. The only significant economic report - the November empire state manufacturing survey - came in below expectations so there's very little for traders to get excited about. Technical breakdowns on the weekly charts of all of our major indices, along with the breakout in expected volatility (VIX) are likely to add to nervousness in the very near-term so please be careful today and throughout the week. Here is an illustration of the poor action to close out last week:
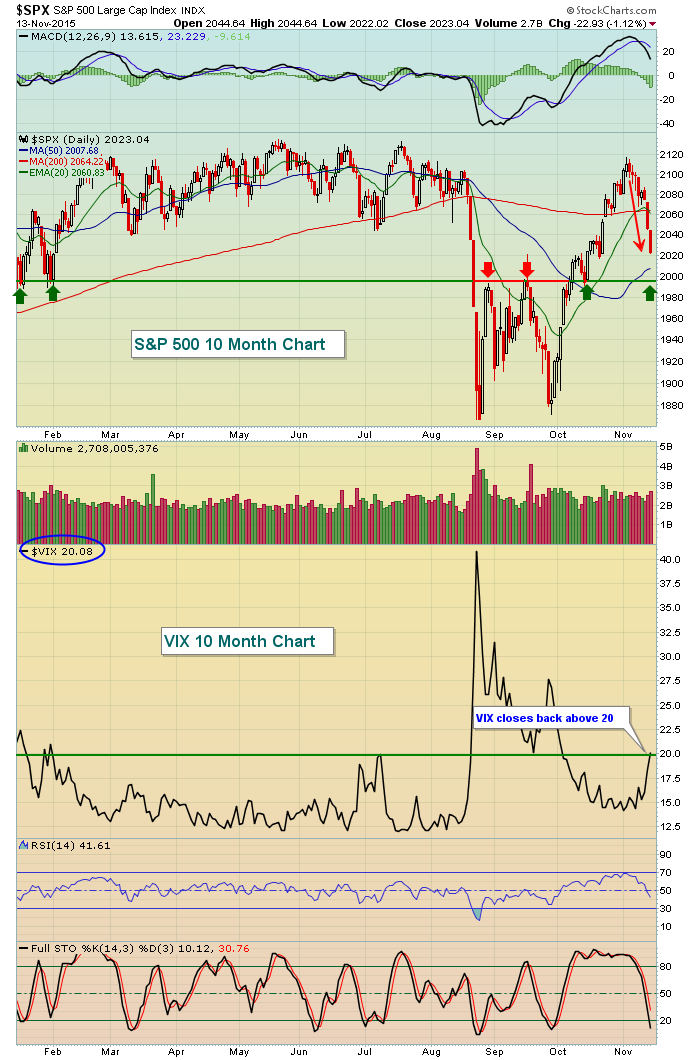
Impulsive episodes of selling accompany spikes in the VIX so we MUST respect the fact that technical conditions have changed in the market over the past week. High fear levels tend to mark important bottoms, but we haven't seen any kind of reversal in the VIX. So it's difficult to say how far the market drops in the near-term before an important bottom is found. The next level to watch for on the S&P 500 is just below 2000. As you can see from the above chart and the red and green arrows, resistance and support have been found several times near this level throughout 2015. It's an obvious area to check the pulse of traders if the heavy selling from last week resumes today.
Current Outlook
Action in retailers last week has really muddied the waters. Retail is a key part of consumer discretionary (XLY) and this is a sector that has been leading the market throughout much of the bull market. On a relative basis, the XLY continues to trade well on a relative basis against consumer staples (XLP), but seeing such weakness in retail is not something the bulls want to see. Earnings reports have been very disappointing among some big names like Macy's (M) and Nordstroms (JWN).
I'm not sure if it's good news or bad news, but there'll be several more earnings announcements in the retail space, with perhaps the biggest name - Home Depot (HD) - reporting Tuesday before the bell. Wall Street is expecting a quarterly profit of $1.32 and this group can't afford any further disappointment. In recent past, HD has reported better-than-expected results and the price action of late shows that traders still have high hopes for this Dow component. Check out the chart:
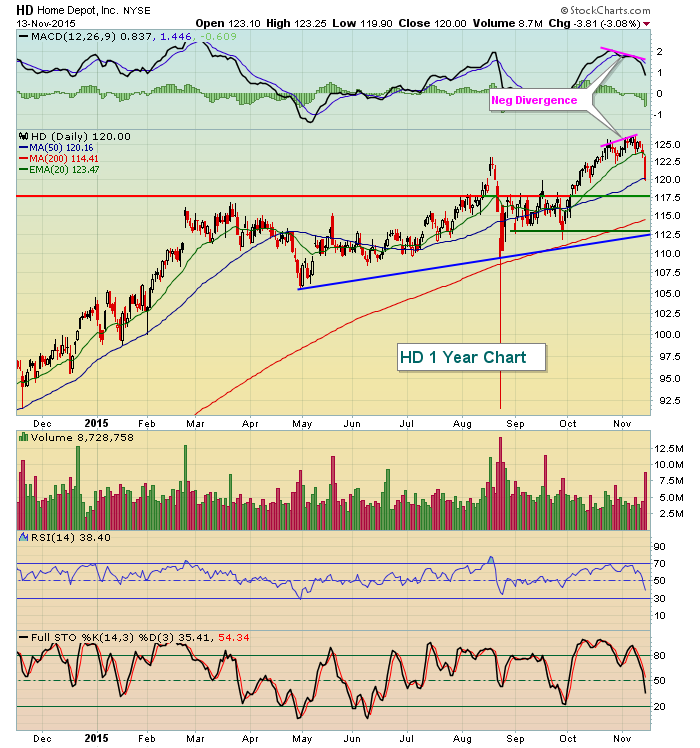
HD's chart isn't perfect, but it did at least warn of its recent weakness with the negative divergence that printed with its most recent price high. As I look at the chart, I'd be okay with slightly lower prices on HD, perhaps down to the 112.50-117.50 range, though lower prices would be a technical issue for this retail giant.
Sector/Industry Watch
The best performing sector on Friday was materials. One interesting industry group within this space is specialty chemicals ($DJUSCX). After recently testing price resistance from underneath, it's pulled back to test the rising 50 day SMA. Does it hold? My guess is that the longer-term downtrend trumps the recent strength and this 50 day SMA test eventually fails. Here's the chart:
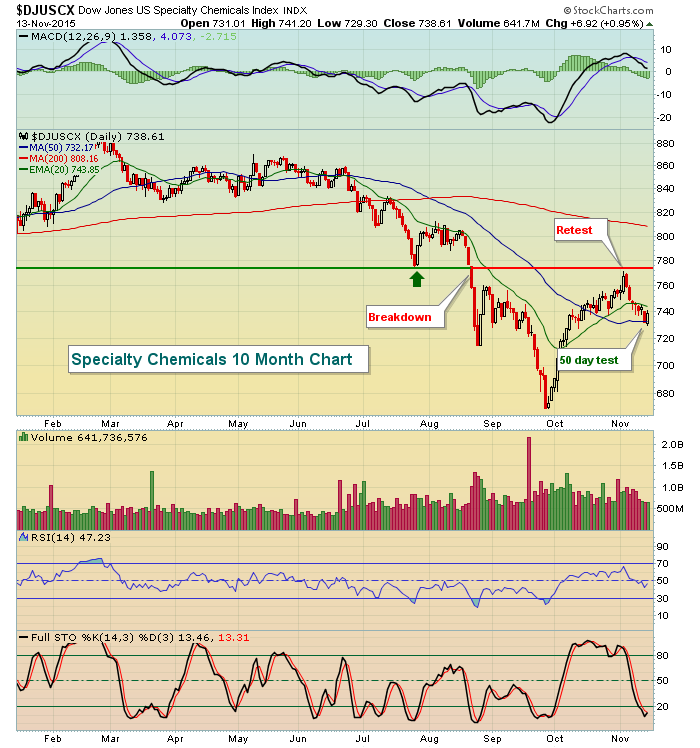
While the 50 day SMA could be the level where buying resumes, if this truly were the beginning of an uptrend, I'd have expected to see more buying at that initial test of rising 20 day EMA support (green moving average line). That provided little support for the bulls and I suspect the 50 day SMA will provide little as well.
Historical Tendencies
For the week November 16th through November 20th, the S&P 500 has risen 53.48% of the days within this one week period since 1950. While this is consistent with the chance of any day being higher on the S&P 500 since 1950, the annualized return for this period is -24.67%. So there's a bearish bias to this week historically.
Key Earnings Reports
(actual vs. estimate):
DDS: 1.03 vs 1.15
MR: .48 vs .31
(reports after today's close, estimate provided):
A: .47
NUAN: .22
URBN: .42
Key Economic Reports
November empire state manufacturing survey released at 8:30am EST: -10.74 (actual) vs. -5.0 (estimate)
Happy trading!
Tom


