Market Recap for Friday, December 4, 2015
Major indices here in the U.S. rebounded Friday in a big, big way after Thursday's drubbing. During uptrends, I always look to rising 20 day EMAs for support. On Thursday, all of our major indices lost 20 day EMA support, but they all quickly regained that moving average with Friday's rally. There once again appears to be a solid chance for a breakout to all-time highs on the S&P 500. If it occurs, I'll be looking to see what areas of the market lead that advance for clues as to its sustainability.
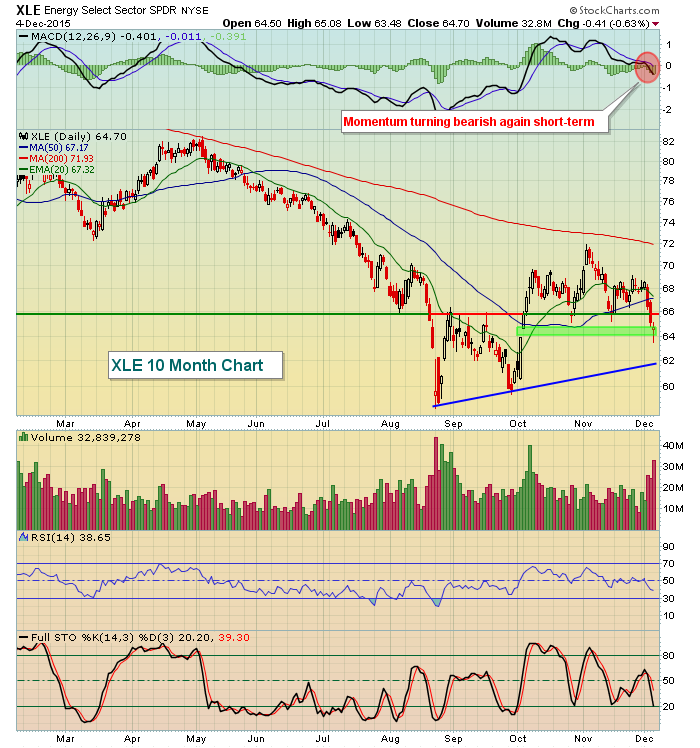
Eight of nine sectors advanced on Friday with energy (XLE) the lone defector. That weakness in the XLE was significant, however, as key short-term price support was lost in the process. One of the biggest problems during 2015 has been the lack of wide participation in the attempted S&P 500 breakouts. Energy and materials (XLB) showed considerable relative weakness beginning in 2014 and have been the primary culprits in terms of holding back this bull market. Check out both the short-term and longer-term charts of the XLE below:
XLE Daily Chart:
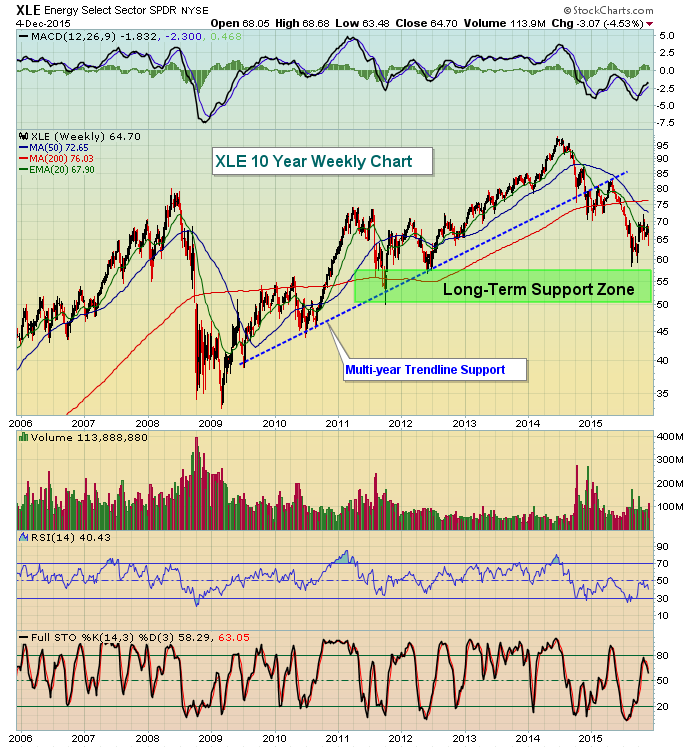
Losing the price support close to 66.00 last week on increasing volume and with a MACD moving back beneath centerline support is a double negative. Moving back above 66.00 will be the short-term objective. Failing to do so opens the door to more selling as reflected below on the weekly chart:
Long-term trendline support was lost in late 2014 and bounces since that time have failed, including our last attempt. This weekly chart would suggest a move back down into the upper 50s to test the price lows of 2012 and 2015. A move down to that level could establish solid long-term positive divergences, which could mark a very significant long-term bottom, however.
Pre-Market Action
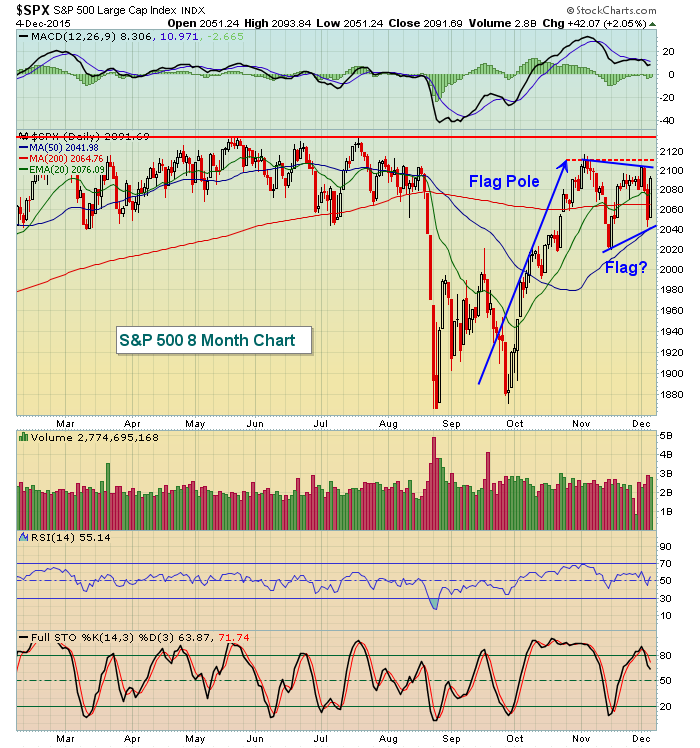
Action in Asia overnight was mixed, but mostly higher. European markets are quite strong and that appears to be carrying over to U.S. futures, which look to build on Friday's strong gains. Gains thus far are modest, but it won't take much to forge a short-term breakout. Here's a quick glance at the S&P 500 chart showing the key save at rising 20 day EMA support and the overhead resistance close to 2115 (red dotted line), then all-time closing resistance at 2131 (solid red line):
One of the hallmarks of a consolidating market is the constant breaches of short-term moving averages. In a trending market, these moving averages tend to provide excellent support/resistance. As you can see from the above, the months leading up to the August selling saw a barrage of failed support/resistance at the 20 day EMA. Also, note the daily RSI remained almost exclusively between 40 and 60, never reaching overbought or oversold territory. It was frustrating action. Since the bull flag recovery, we've seen two more of those 20 day EMA failures - in both directions. These failures are once again taking place between 2050 and 2130, an area of indecision throughout 2015. Clearly, we need a closing breakout above 2130 and we need it to coincide with strong market action under the surface.
Current Outlook
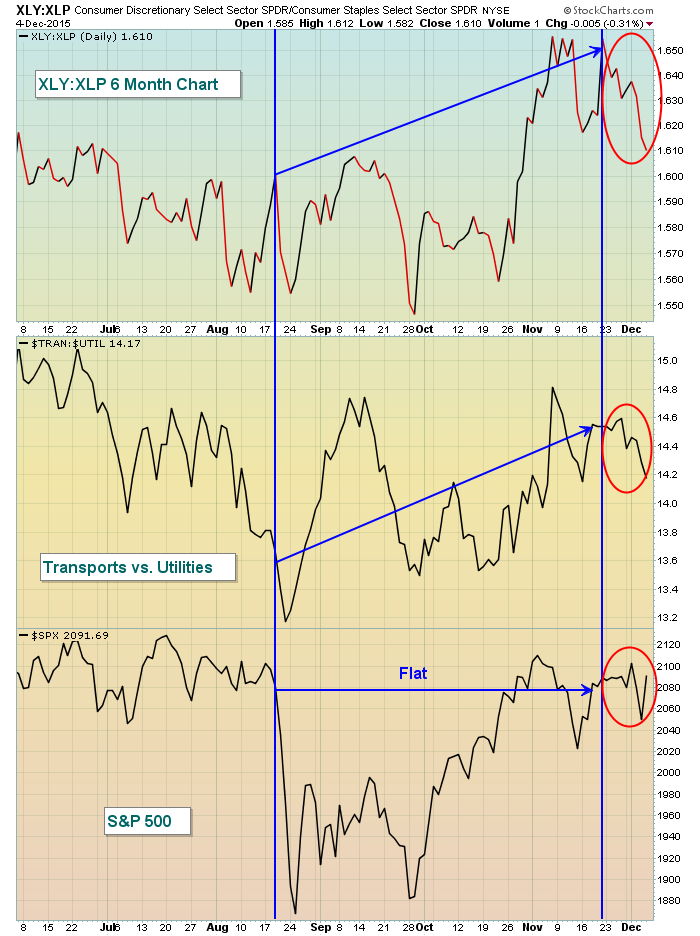
The rebound on Friday was very impressive and was similar to what we saw a few days earlier in the bond market. If you recall, I was concerned by the sudden drop in the 10 year treasury yield ($TNX) below 2.23% support. But sellers of treasuries returned and the TNX surged back to 2.35%, a necessity in my view to provide the bulls an opportunity to clear all-time closing high resistance of 2131 on the S&P 500. A couple of the "below the surface" signals that I watch closely began to show a bit of deterioration that we'll want to continue observing - especially if the S&P 500 makes that much anticipated breakout to all-time highs. Here's the deterioration I'm speaking of and it's a reprint of a chart I included in my weekend ChartWatchers article:
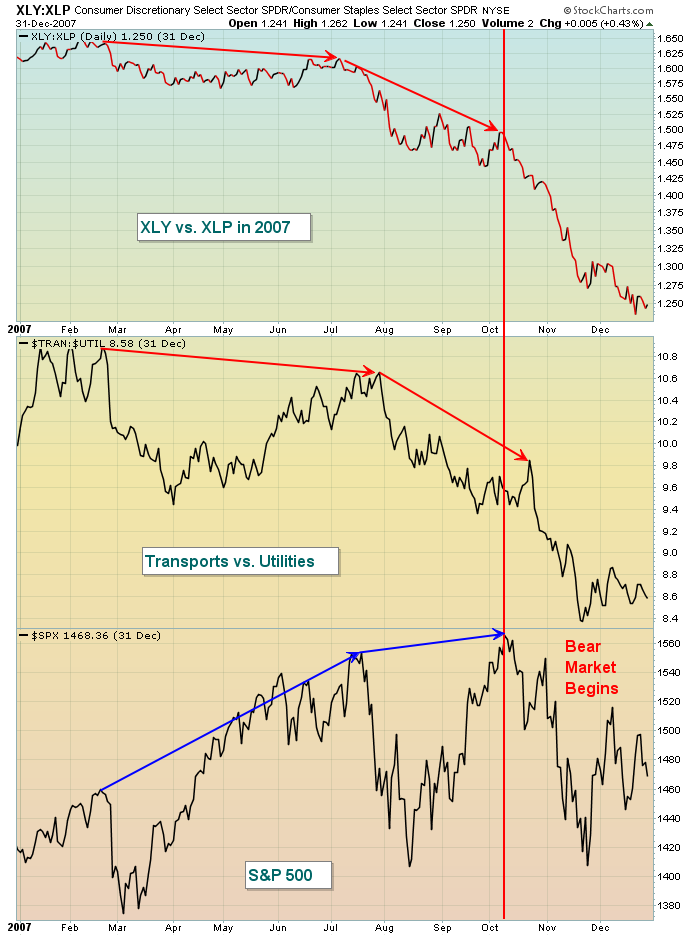
The red circles above simply show that over the past two weeks, the S&P 500 has been volatile but finished on Friday very close to where it finished a couple weeks ago. But the relative ratios of the XLY:XLP and TRAN:UTIL have both dropped as money rotates more towards defensive areas. If the S&P 500 continues to push higher and ultimately breaks to all-time closing highs, I'm not going to feel comfortable if this relative deterioration in aggressive areas continues. Take a quick glance at how these ratios fell dramatically in 2007 PRIOR to the start of the bear market:
I remain bullish, I'm just offering up a few cautious words and a couple charts to keep an eye on to provide us clues as to sustainability of a potential market advance. In addition to the above, I'd like to see further strength overseas, especially in Germany ($DAX).
Sector/Industry Watch
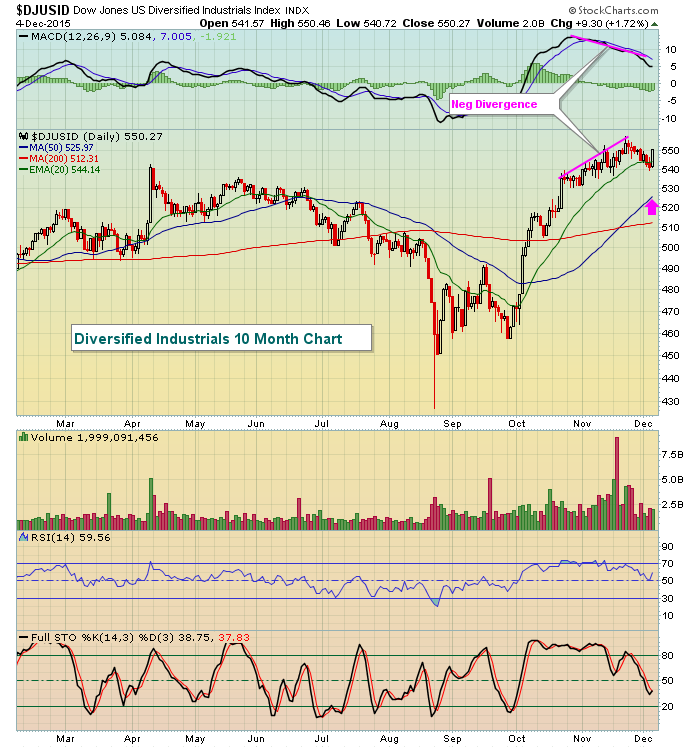
Diversified industrials ($DJUSID) have been a super performer over the past three months, but there's a negative divergence in play that suggests we could see an upcoming 50 day SMA test, currently at 526. Check it out:
Not shown above is the weekly chart where the MACD is strong and the rising 20 week EMA (a normal level for a pullback) is at 521 and rising rapidly. Therefore, both the daily and weekly charts would be best served by a pullback to this area in time. General Electric (GE), a key component of this index, shows similar characteristics on its chart.
Historical Tendencies
We are entering a period of neutrality on our major indices (7th through 10th of December). The 11th to 15th actually turn more bearish so keep that in mind as you navigate the next week to ten days.
Key Earnings Reports
UNFI: .69 (reports after closing bell today)
Key Economic Reports
None
Happy trading!
Tom

