Market Recap for Monday, December 7, 2015
As baseball great Yogi Berra would famously say, "It's deja vu all over again". The S&P 500 keeps trying - and failing - to break out and one big reason is the lack of participation from energy stocks (XLE). The XLE lost short-term price support near 66.00 toward the end of last week and it's been an ugly move lower since. The XLE finished at 62.24 on Monday, down another 3.8% on the session. Materials (XLB), another culprit of the 2015 stagnation in equities, fell 1.8% as the only other sector to fall more than 1% Monday. Consumer discretionary (XLY), technology (XLK) and financials (XLF) all lost less than 0.5% so the losses on paper for the S&P 500 were much worse than what the "underneath the surface" action might otherwise indicate. It still hurts nonetheless. And it wasn't as if there was no sector rotation damage. The XLY:XLP ratio closed at a six week low. Transportation stocks ($TRAN) are struggling, although the low crude oil prices are lifting airline stocks ($DJUSAR).
Railroads ($DJUSRR), a reasonable gauge of our domestic economy prospects, have taken another turn for the worse as you can see from the weekly chart below:
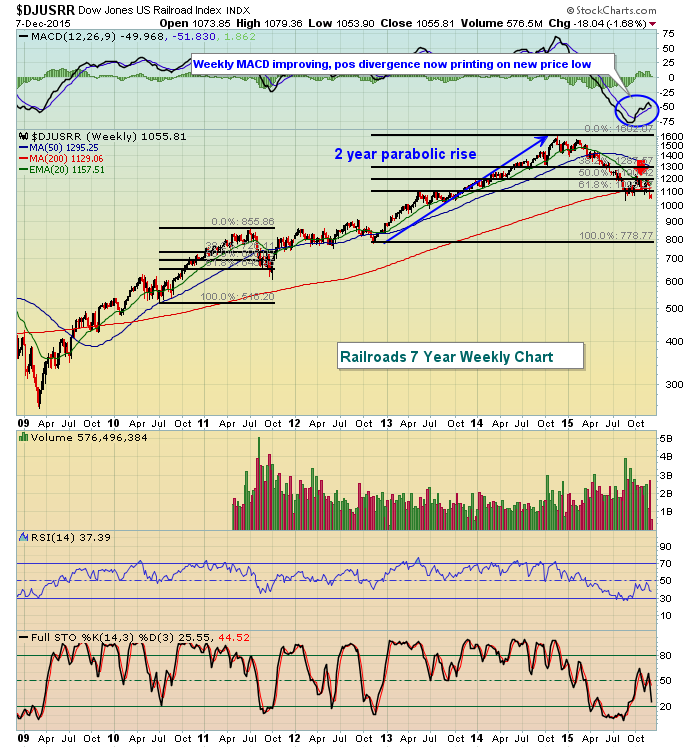
I've used the Fibonacci retracement tool here at StockCharts.com to highlight the action after two parabolic rises in railroads during the current bull market. As a StockCharts.com member, you can use this tool and many others to annotate key potential pivot areas for indices, sectors and/or individual stocks. Note that after the approximate 60% advance in the DJUSRR from 2010 to 2011, this index retraced roughly 61.8% before resuming its prior trend. The current picture doesn't look much different to be quite honest. Instead of a 60% advance over one year, the latest rise was of the two year variety and totaled 100%. Therefore, more points have been lost on the way down, but the Fib retracement zone is currently the same as it was in 2011. I believe the DJUSRR is one of the key indices that needs to rebound in order for our major indices to make a meaningful breakout later this month or in early 2016.
Pre-Market Action
Once again, we have little U.S. economic information to trade off and really won't see anything significant until Thursday's initial jobless claims. In the meantime, the bulls are trying to hold onto recent price support and action overseas is a bit more in the spotlight. Unfortunately, all European markets are down more than 1% this morning. That follows lower prices across Asia overnight as trade data out of China was very weak. Then there's the crude oil debacle with crude tumbling on Monday. All of this has U.S. futures on the defensive with perhaps losses of 1% at today's open if conditions don't change in the next 30 minutes.
The bulls' resiliency will once again be under fire throughout the day.
Current Outlook
We remain in a short-term trading range within a longer-term bull market. But short-term action shows that the bears are in control right now. We also are in a period where there is typically historical weakness in U.S. equities. Throw in the awful performance of energy stocks and the skepticism among traders is not that difficult to understand. Volatility ($VIX) is currently under control, but a break above 20 would be a sign to batten down the hatches as selling can accelerate very quickly under such an environment. This crazy back and forth action isn't easy and it doesn't matter if you're bullish or bearish. The insanity feels the same. If you're mindset if geared more toward the long-term, the recent back and forth action shouldn't be too alarming, but as a shorter-term day trader or swing trader, these moves can be costly and monotonous. Small caps (Russell 2000 or $RUT) have a track record of performing extremely well during the month of December, but they have a tendency to perform very poorly from December 7th through December 15th (see the Historical Tendencies section below). Here's the short-term trading range of the RUT on an hourly chart with levels to watch as support/resistance:
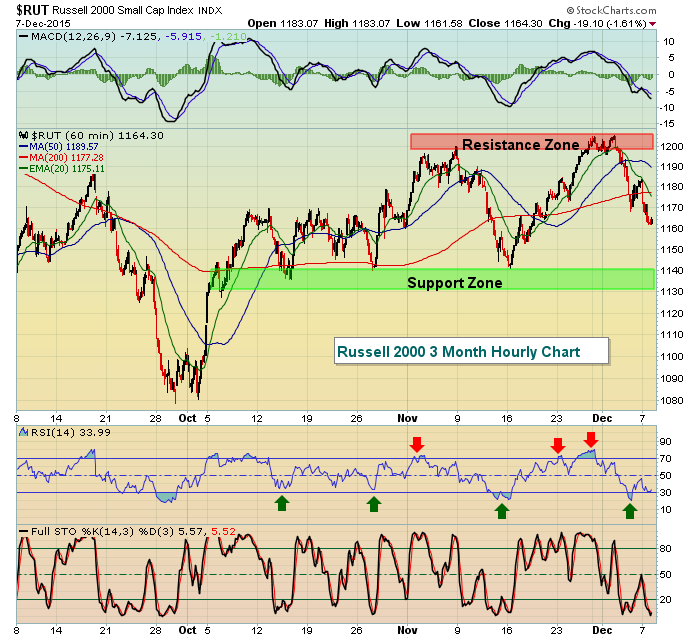
You can see from the red and green arrows that RSI provides decent entry and exit clues during a trendless market as key overbought (70) and oversold (30) levels are reached. During uptrends, we rarely see RSI 30 support tested. During downtrends, we rarely see RSI 70 resistance tested. So the fact that we continue to see the RSI moving all the way from 30 to 70 and vice versa is further technical confirmation that we're simply moving back and forth as the market searches for direction and its next move - either higher or lower.
Sector/Industry Watch
There is simply nowhere for cover in the energy space. I know crude oil ($WTIC) is getting a ton of media coverage, but deservedly so. Is it a demand problem? Is it a supply problem? Yes and yes. This combination has crude oil tumbling and on Monday the WTIC closed at 37.62, its lowest close since the lows of February 2009. The lowest close back then was 33.98 on February 12, 2009. It appears that's where we're heading on crude oil now - to challenge those lows. While four of our nine sectors have been higher over the past six months, EVERY industry group within energy has been down more than 10% over the same span. There's literally nowhere to turn. The Dow Jones U.S. Pipelines ($DJUSPL) are down 49% over that period and are currently freefalling as the following chart clearly depicts:
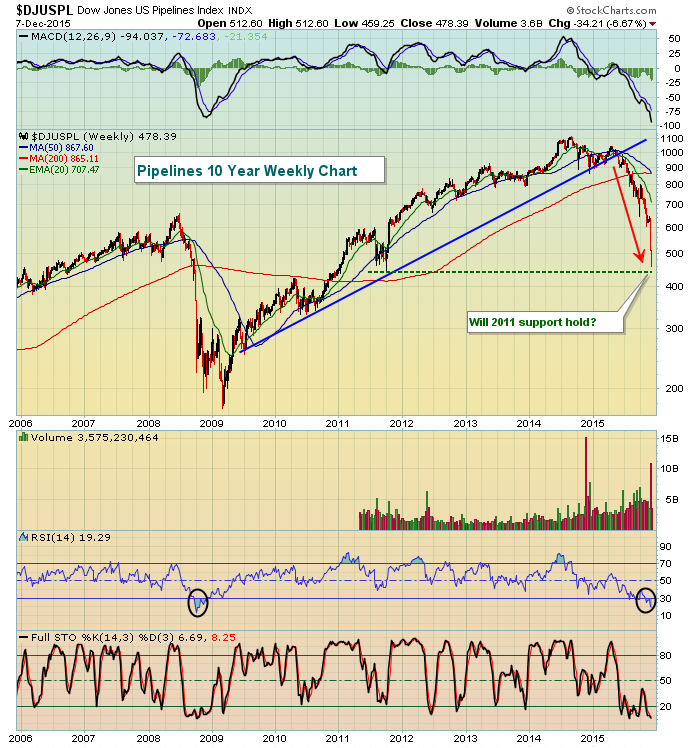
This is likely a capitulatory move, but the problem is that things can get much worse in the near-term so it's difficult to call an exact bottom. In the meantime, extreme volatility can create much larger losses before a reversal occurs. The upcoming test of 2011 lows is one area where we could see the bulls take a stand. We'll see.
Historical Tendencies
As a reminder, here are the annualized returns for the Russell 2000 during the current bearish period from December 7th through December 15th:
December 7 (yesterday): -48.29%
December 8 (today): +66.03%
December 9 (Wednesday): -47.06%
December 10 (Thursday): -33.32%
December 11 (Friday): -98.39%
December 14 (next Monday): -79.24%
December 15 (next Tuesday): -105.68%
Key Earnings Reports
(actual vs. estimate):
AZO: 8.29 vs 8.20
TOL: .80 vs .83
(reports today after close, estimate provided):
COST: 1.17
KKD: .21
Key Economic Reports
None
Happy trading!
Tom


