Market Recap for December 8, 2015
I indicated on Tuesday morning that the bulls' resiliency would be tested as our major indices were poised to open significantly lower. They proved they're a resilient bunch once again, frustrating those on the bearish side of the aisle. It feels like the current market environment is designed to frustrate both sides of the market with no clear direction in place. My only reminder is to back off the day-to-day action and focus instead on the big picture. October 2014 lows have held, but we've been unable to break out to all-time highs. This reflects lack of commitment and sustainability and that's typical during consolidation periods. It's most definitely frustrating, but there's nothing we can do about it. It is what it is for now and we just need to deal with it. From a longer-term buy and hold approach, none of this matters as the strategy never changes. But from a shorter-term trading perspective, it seems as though the market keeps moving from buy signal to sell signal back to buy signal and creates trading confusion. Just keep in mind that trading less during periods like this is probably the best answer.
Our major indices finished lower on Tuesday, but there was relative strength in Russell 2000 shares and especially in NASDAQ shares. So despite the negative action, traders were not abandoning the high beta stocks that typically suffer most during a meaningful selloff. That was the primary positive to take away from Tuesday. Energy (XLE) was weak again but did manage to print a hollow red candle and that suggests that perhaps traders see a tradable bottom. Recent price support has been found in the high 50s and Tuesday's low was 60.25. This would be an area where I'd expect to see buyers emerge - even if just temporarily.
Energy bulls can take solace in the fact that energy wasn't the worst performing sector. That award goes to materials (XLB), which dropped nearly 2% on the session and is rapidly approaching key short-term price support of its own. Check it out:
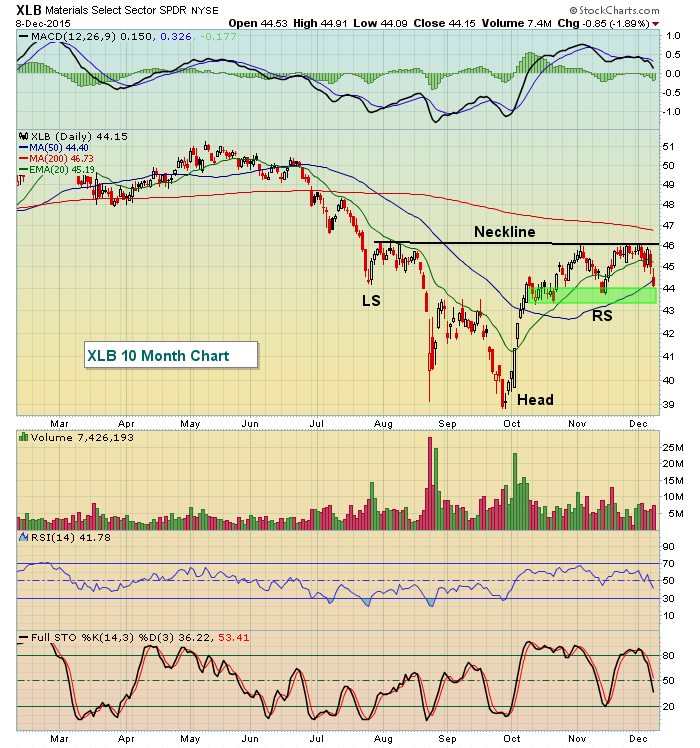
The green shaded area shows price support to be in the 43.25-44.00 zone. That marks reverse right shoulder support as well. While this reverse head & shoulders pattern is a bullish development, it doesn't confirm until we see the closing breakout above neckline resistance at 46.00. Reflective of current market conditions, which are utterly confusing, industrials (XLI) are potentially in a topping head & shoulders formation, which is illustrated today in the Current Outlook section below.
Pre-Market Action
Asian markets were fractionally lower overnight and most European markets are doing the same at last check. The U.S. futures, meanwhile, are lower with a bit more weakness on the NASDAQ. Costco (COST) came up short in terms of its latest quarterly results and other companies reporting last night and this morning are also struggling including Lululemon (LULU) and Smith & Wesson (SWHC). Vera Bradley (VRA) is bucking the trend after a very strong revenue and earnings beat.
Current Outlook
Industrials (XLI) represent one of the four aggressive sectors of the stock market - along with technology (XLK), consumer discretionary (XLY) and financials (XLF). I believe it's always important to follow the action in these four sectors because it provides us a pictorial description of traders' psyche. Therefore, both bullish and bearish developments in these four sectors is important in determining future market direction. The XLI was very weak on Tuesday, declining 1.6%, but one day certainly doesn't make a trend. The problem, however, is that the XLI has been mired in a potential topping head & shoulders pattern since the head formed in November with a negative divergence present. Take a look at the visual:
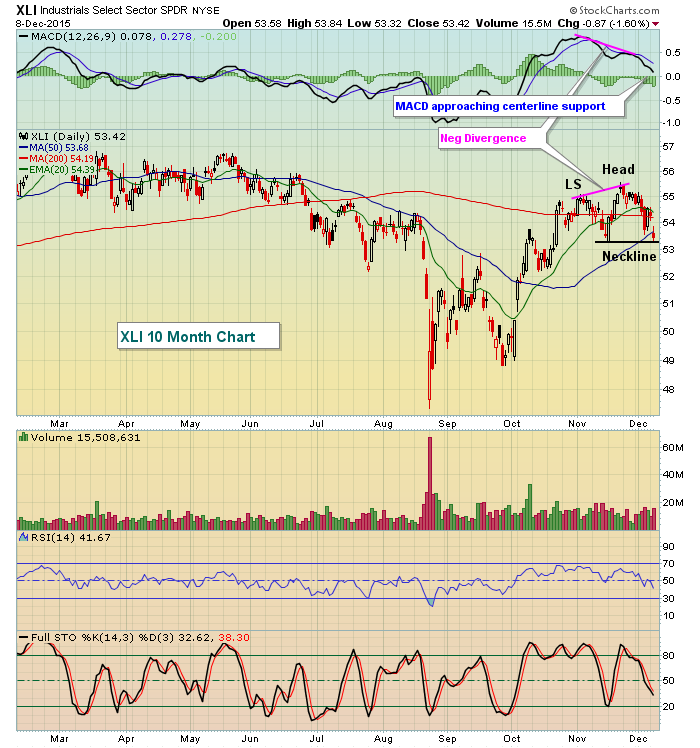
A couple things here. First, just like the XLB chart earlier, this potential topping pattern doesn't confirm until it fully develops and then breaks down beneath neckline support. Second, a bounce later in December could print the right shoulder so we'll need to be aware of that. Third, note that the negative divergence has now resulted in a 50 day SMA test and a near MACD reset at its centerline. This combination can be the launching pad for the next leg higher on the XLI so nothing has been resolved as of yet. Finally, we've been in an uptrend and RSI support generally resides in that 40-50 area during uptrends. Currently, the RSI on the XLI is just above 40.
While I remain bullish the overall market currently and believe the odds are higher that we'll see a breakout vs. a breakdown, the charts today on the XLI and XLB show how difficult it is to figure out market direction when consolidation is the name of the game. I'll continue to look for clues as to market direction in the days and weeks ahead. But in my opinion, the big picture shows more bullish tendencies than bearish.
Sector/Industry Watch
I've discussed above how it's important to physically see patterns confirm as opposed to assuming they'll confirm. So today, I'll use this section to illustrate a pattern in the past that never confirmed. Assuming it would confirm would have been devastating financially. Check this chart out:
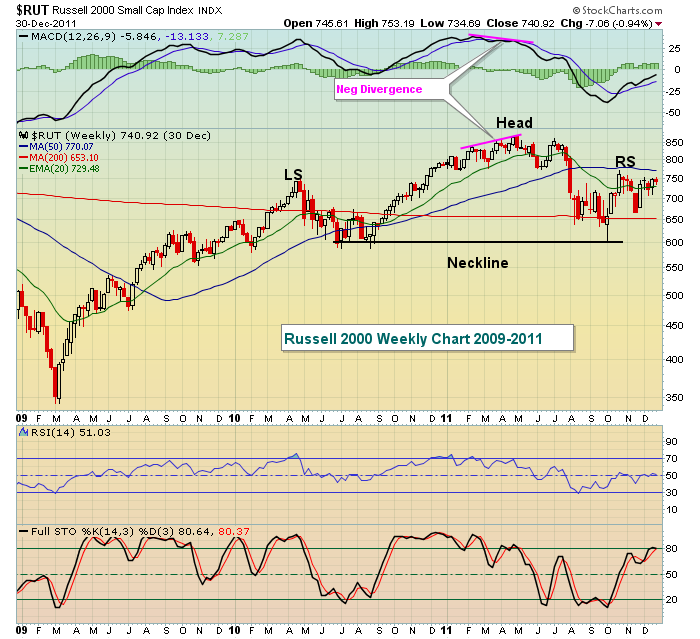
That's an ugly chart. Negative divergence. Head & shoulders topping pattern. Loss of MACD centerline support. It was over right? WRONG! Those lows on the right side of neckline support were never revisited and four additional years of strong gains followed. We MUST see the confirmation (in this case, breakdown), not just recognize the patterns.
Historical Tendencies
Yesterday, I provided annualized returns on the Russell 2000 (since 1988) for each day during its current neutral/bearish period that runs from December 7 through December 15. Today, let's turn to the S&P 500. Since 1950, mid-December has posed undeniable head winds for the stock market. It doesn't mean we'll see a crash. It doesn't mean we'll see the S&P 500 trudge lower day after day during this period, although it's certainly a possibility. Instead, I view the historical tendencies as another indicator that I use to determine the probability of an advance or decline. I use it to support or refute the technical conditions that I'm observing. For instance, if the S&P 500 is up against major price resistance or prints a negative divergence just as it enters a bearish historical period, I use that historical tendency to further confirm the idea of a top based on technical indications.
Currently, the S&P 500 is range bound as reflected below:
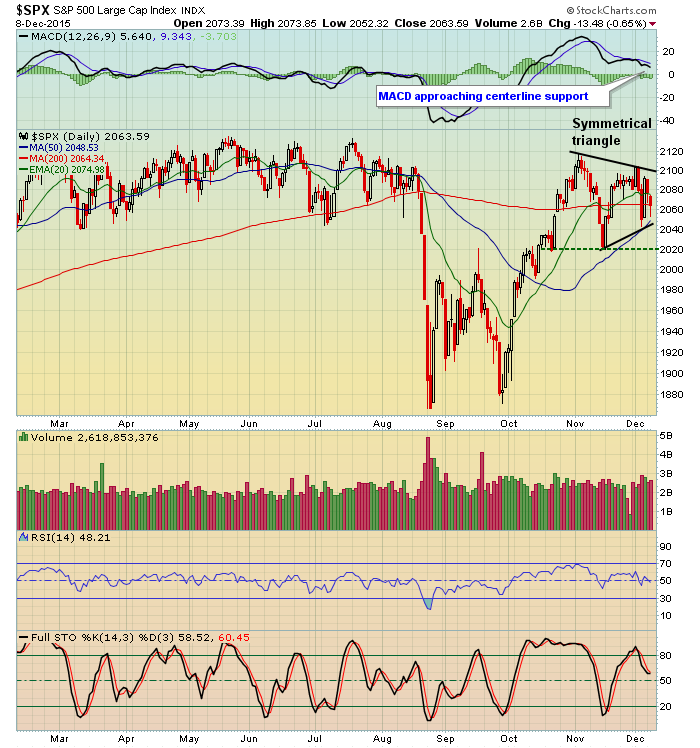
There's room in the current symmetrical triangle pattern to both the upside and downside. The green dotted line shows key price support at 2020, which I've illustrated several times recently as a very significant price support level. It's certainly not out of the question we'll revisit that level. Unlike the Russell 2000, though, the S&P 500 has a much more defined bearish historical period from December 11 through December 15. It's shown to be neutral to bearish in every decade since 1950 with only the 1960s showing any strength at all. In the current decade, December 11 through December 15 has produced 6 days higher and 11 days lower with an overall annualized return of -107.95%. So the tendency that we've seen over the past 65 years most definitely has stayed its course this decade. Here are the annualized returns for each day in this period since 1950:
December 11 (Friday): -40.51%
December 12 (Saturday): -14.82%
December 13 (Sunday): -9.90%
December 14 (Monday): -50.93%
December 15 (Tuesday): -35.87%
Key Earnings Reports
(actual vs. estimate):
LULU: .35 vs .37
VRA: .27 vs .20
(reports after close today, estimate provided):
KFY: .52
MW: .50
Key Economic Reports
October wholesale inventories to be released at 10:00am EST: +0.2%
Happy trading!
Tom


