Market Recap for Monday, January 26, 2016
The afternoon action on Monday is so typical of a stock market environment where the Volatility Index ($VIX) is in the 20s or 30s. We seemed to be in a fairly narrow trading range from 1890 to 1910 on the S&P 500 and then, all of a sudden, the S&P 500 fell more than 1% in 2 hours. Why? Well, partly it's due to the high VIX level. It's difficult to trust any moves to the upside as impulsive selling tends to kick in out of nowhere. Rotation back into safety, though, did send up a few red flags. Take a look:
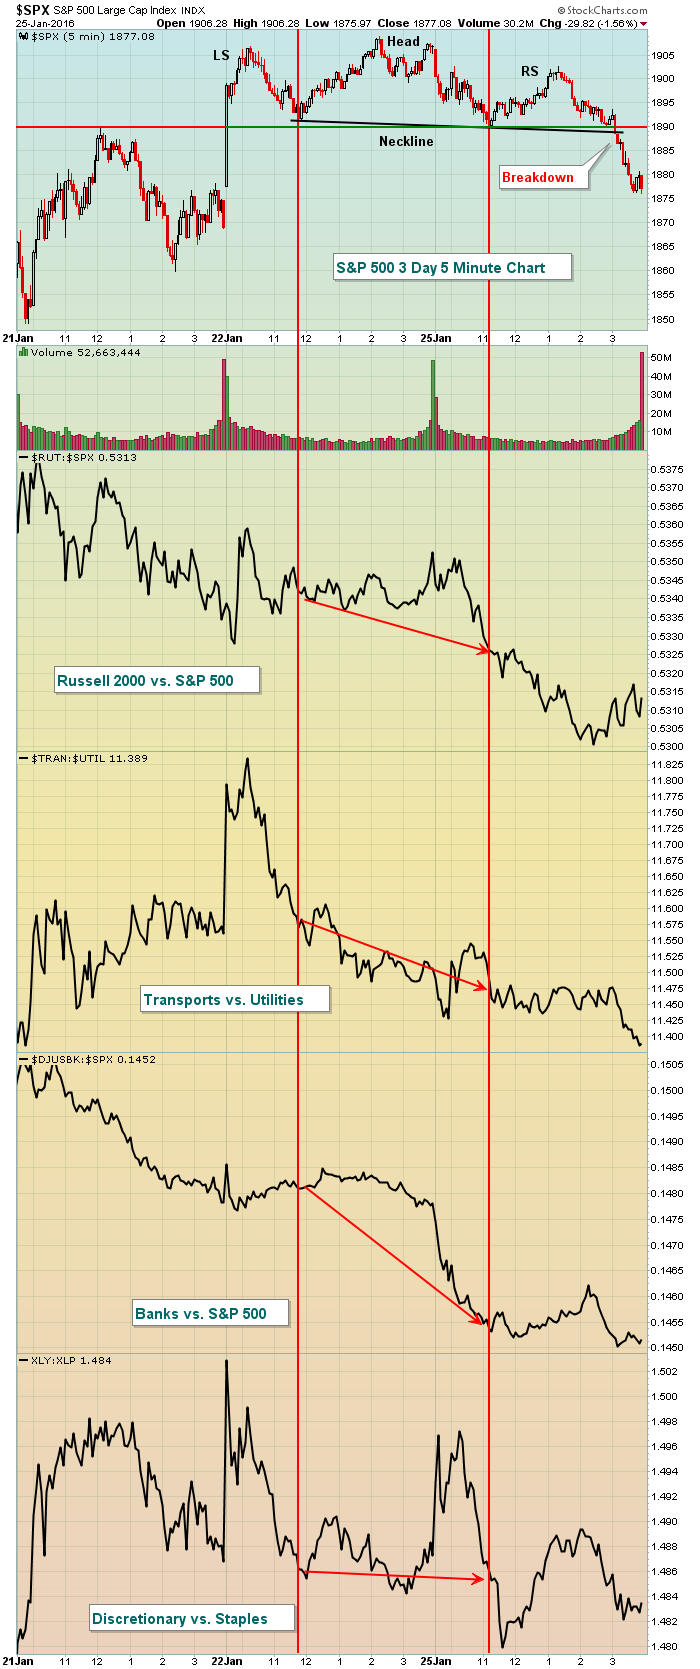 First, understand this is a very short-term chart so it's not designed to provide us any long-term signals. But as a short-term trader, I realize that a number of bearish developments have taken place in the longer-term so I try to determine when the short-term rally could be in technical trouble. The above chart was used to look for a potential short-term top. Note the head & shoulders topping pattern that was confirmed on the neckline breakdown in the final hour on Monday. Also, that breakdown included the loss of price support near 1890 (from Thursday's intraday high). Broken resistance became support, then was lost. I've drawn red vertical lines on the chart to highlight where the various intermarket relationships were at the left side of the neckline and the right side of the neckline. While the S&P 500 was relatively unchanged, you can see the deterioration in these intermarket relationships fairly clearly.
So while the technical breakdown was important, following the intermarket relationships identified at the bottom of the above chart was even more significant because it prepared me for the likelihood of a breakdown. During the short-term topping period, money began rotating more defensively once again. It didn't guarantee a move lower, but it did provide a clue that risk was elevated. Holding, as a short-term trader, didn't really make sense. Why ignore the signals that the market is sending us? Given the high volatility, we need to expect impulsive selling episodes. The game has changed. I'm no longer expecting to buy on weakness. Instead, I'm looking to sell on strength. And that will continue until the market tells me otherwise.
In case you didn't notice, all three defensive sectors led the market on Monday once again. Utilities (XLU) fared best, followed by consumer staples (XLP) and healthcare (XLV). Energy (XLE), after having led the bounce since last Wednesday, once again resumed its weak relative performance, dropping 4.66% on the session.
Pre-Market Action
U.S. futures were down overnight, but have since recovered and are currently pointing to a modest opening gap higher. Asian markets were trounced overnight with the China Shanghai ($SSEC) down another 6.4% as the SSEC closed at its lowest level since December 2014. I'd expect another 10% downside on the SSEC before longer-term support is reached close to 2500. The close last night was 2750.
European indices are up fractionally this morning after being down quite a bit earlier this morning in reaction to the big losses in Asia. Earnings this morning have been solid with 3M (MMM) beating its EPS by more than 10%. While MMM looks to open a bit higher, its falling 20 day EMA is likely to be problematic. We'll see.
All eyes are now turning to the Fed as they begin their two day meeting today. What will they come up with tomorrow? It's going to be interesting - and I'll be watching it completely from the sidelines.
Current Outlook
In the very near-term, a key price support level was established last week because of a capitulatory-type selloff on heavy volume and with a huge spike in volatility ($VIX). Momentum is quite strong to the downside, however, as evidenced by weak daily MACDs across most of our major indices, sectors and industry groups. Below is a chart of the S&P 500, highlighting the current trading range and the deterioration of bank ($DJUSBK) relative strength:
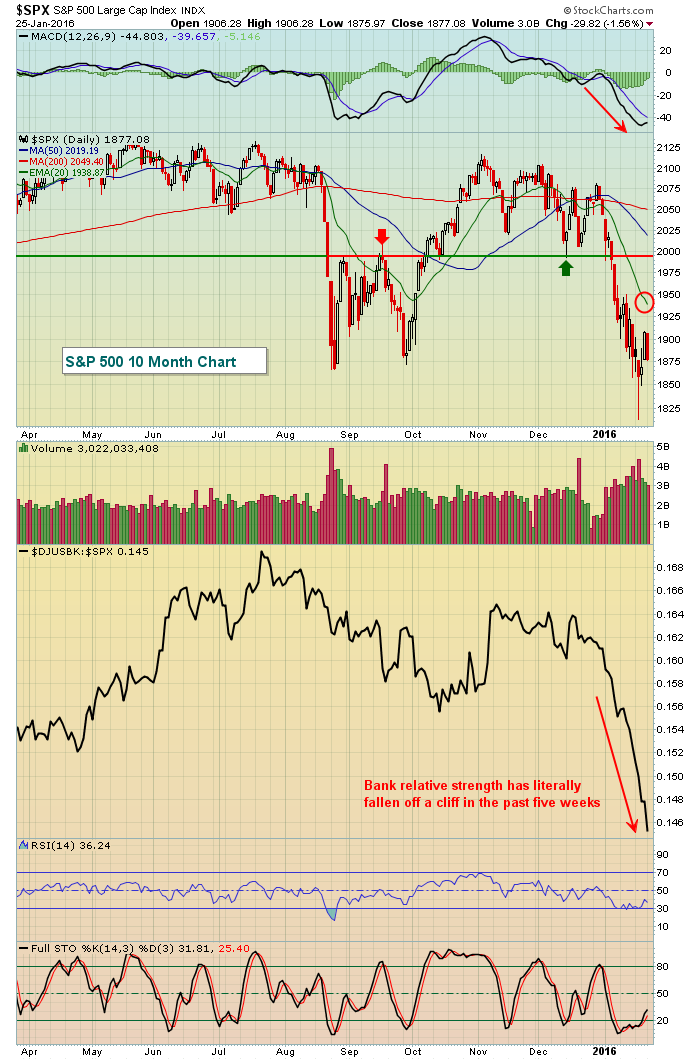 The red circle marks the most important short-term resistance level in my view. The rapidly-declining 20 day EMA is currently at 1939 and technically represents a short-term sell signal. Any time I see a daily MACD pointing straight down like the S&P 500's, I view the 20 day EMA as major resistance. It doesn't mean it can't go through. Many non-technicians would point to that as proof technical analysis doesn't work. That's because they believe that technicians view technical probabilities as guarantees, which they are not. Instead, I use technical indicators as a means to manage risk, which I believe is true of most technicians. The odds are high that this moving average stalls the rally.
The relative weakness of banks is quite clear, isn't it? That line pointing down doesn't mean banks are moving lower (although they are). Instead, it highlights that banks are underperforming the S&P 500 nearly every single day. Put another way, there is mass distribution of bank stocks right now. If the Fed's claim that 2016 will produce economic strength and higher interest rates (both conducive to higher bank profits), why in the world would banks be performing so poorly?
Sector/Industry Watch
With Apple (AAPL) reporting its earnings tonight, let's take a look at the index that houses the tech giant. There is room to the upside in the Dow Jones U.S. Computer Hardware index ($DJUSCR) before the bears will get nervous. Check it out:
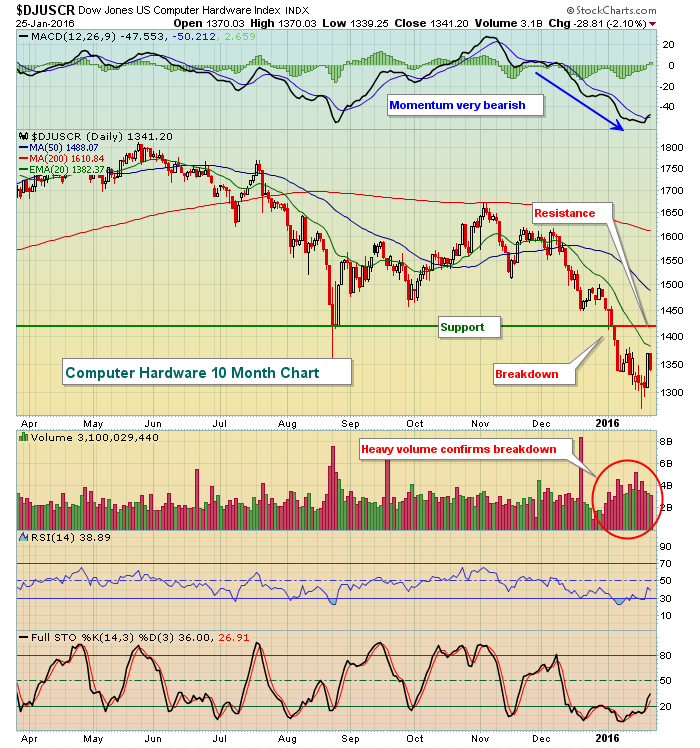 While the technology ETF (XLK) continues to trade above August lows, you can see that the DJUSCR has not. That price support was lost during this January swoon on very heavy confirming volume. After becoming oversold, the group is currently bouncing with the overall market. Resistance should take place in the form of the declining 20 day EMA (1382), then price resistance closer to 1420.
Historical Tendencies
While technical indicators appear quite challenged, tomorrow marks the beginning of a strong historical period for the NASDAQ. Since 1971, the January 27th to February 6th period has produced annualized returns of 34.33%. Most calendar months see bullishness late in the month into the early part of the subsequent month due to money flows and the anticipation of those money flows. February is no exception. While this is one indicator that favors the bulls, we do have to be mindful of technical conditions, which have turned quite bearish over the past several weeks. The stage is set. History bulls vs. technical bears.
Key Earnings Reports
(actual vs. estimate):
COH: .68 vs .66
DD: .27 vs .26
DHR: 1.27 vs 1.27
JNJ: 1.44 vs 1.42
LMT: 3.01 vs 2.93
MMM: 1.80 vs 1.62
PG: 1.04 vs .98
S: (.21) vs (.27)
(reports after close, estimate provided):
AAPL: 3.23
CB: 2.28
COF: 1.61
T: .64
VMW: .98
X: (.85)
Key Economic Reports
November FHFA house price index to be released at 9:00am EST: +0.5% (estimate)
November Case Shiller home price index to be released at 9:00am EST: +0.7% (estimate)
January consumer confidence to be released at 10:00am EST: 96.0 (estimate)
Happy trading!
Tom


