Market Recap for Friday, January 22, 2016
We are seeing an energy-driven rally for sure. On Friday alone, the XLE (ETF that tracks the energy sector) surged 4.42% and that came on the heels of a 3.11% advance on Thursday. While these gains are nice to see as this bounce is helping to fend off a major bear attack, the strength has done little to change the technical picture. The XLE was very oversold and a bounce was to be expected at some point. Now the real test comes as its declining 20 day EMA is at hand and, if the XLE manages to clear that technical hurdle, significant price resistance is approaching. Take a look at the chart:
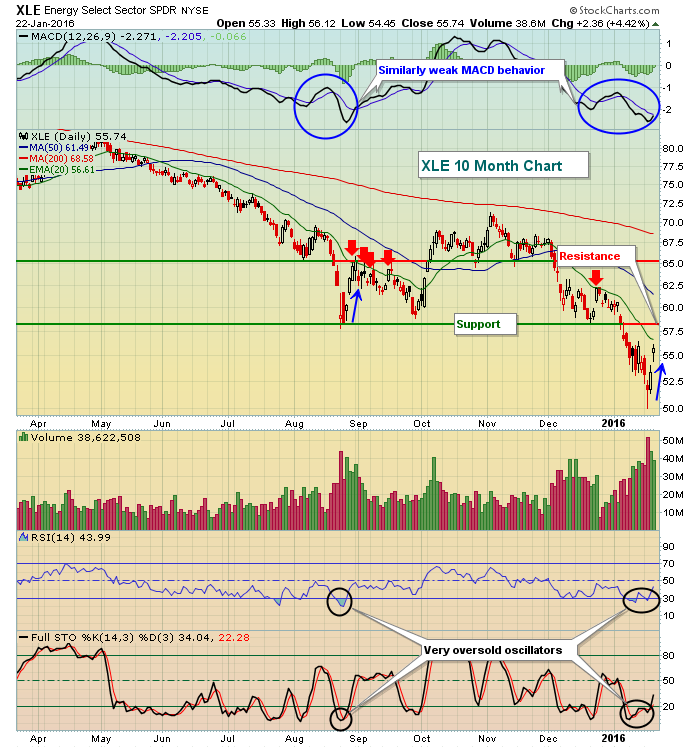 The current rally looks eerily similar to the late August impulsive selling episode followed by an oversold bounce. Note that bounce was defended by the bears at the combination of price resistance and the declining 20 day EMA (red arrows). Friday's XLE rally has left this sector approximately 1.5% from its initial 20 day EMA test. I would expect the rally to fail somewhere in the range from its 20 day EMA (currently 56.61) and price resistance (58.26). A close above 58.26 on solid volume would begin to turn the tables at least a bit more bullish.
There was wide participation on Friday as all nine sectors advanced. Relative weakness was once again found in transportation stocks ($TRAN) which gained 1.32% vs. the S&P 500's rise of 2.03%. Transports also trailed utilities 1.81% gain so the strength on Friday wasn't quite as impressive as it may have seemed. I've highlighted this relative weakness below in the Sector/Industry Watch below.
Pre-Market Action
The number of quarterly earnings reports will begin to pick up in earnest this week and next. So while the U.S. market has been focused on global happenings for much of the past few weeks, some of that focus will turn to earnings reports, guidance and the FOMC meeting that kicks off tomorrow. The last time the Fed met, they hinted at a few more rate hikes in 2016 due to an anticipated increase in inflationary pressures and a strengthening economy. At the conclusion of its last meeting December 15/16, the S&P 500 finished at 2073. At Wednesday's low, the S&P 500 touched 1812. That was an astounding five week drop of 12.59% on our benchmark index. Will the Fed take a different stance and change their policy statement after the stock market's reaction to last month's decision? We'll find out on Wednesday.
Asian markets were higher overnight while European markets have been straddling the breakeven line, taking turns between slight gains and slight losses. Like the U.S. market, many global indices rallied late last week to curb the selling momentum - even if temporarily. I always watch the German DAX ($DAX) with much interest as there's a very strong positive correlation between performance there and performance on the benchmark S&P 500. The bounce in the DAX is nice, but looks quite similar to the bounce that occurred in August. If the rally's failure is similar, then the DAX is approaching a near-term peak. Check this out:
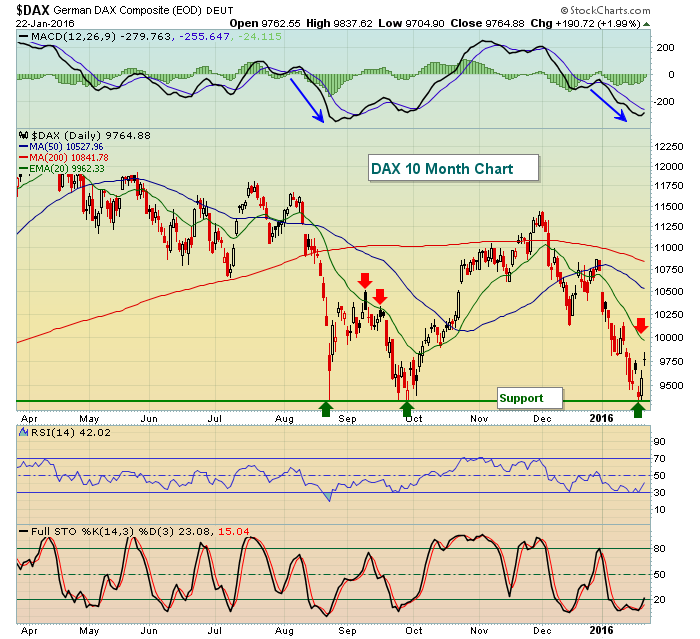 The bounce off support was to be expected, but now that we've seen a rally in Germany, the risk/reward is not particularly attractive any longer. Therefore, continuing strength near that declining 20 day EMA would represent an opportunity to sell long positions.
Current Outlook
I think the Fed's in a box. Clearly, their stance last month was not well received by the equity market. And the action in the stock market over the past couple months is painting a picture of economic weakness ahead given all the rotation into defense and safety. If the Fed backtracks, however, then they lose credibility which may actually be a worse alternative. So what will they do?
Technically, the S&P 500 appears to be in a similar position to 2007/2008. While I'm not calling for significant losses like we saw then, I do believe that the odds are much greater we've entered a bear market, with the next price low beneath 1812 likely confirming it. Take a look at how the S&P 500 looked technically in 2007/2008:
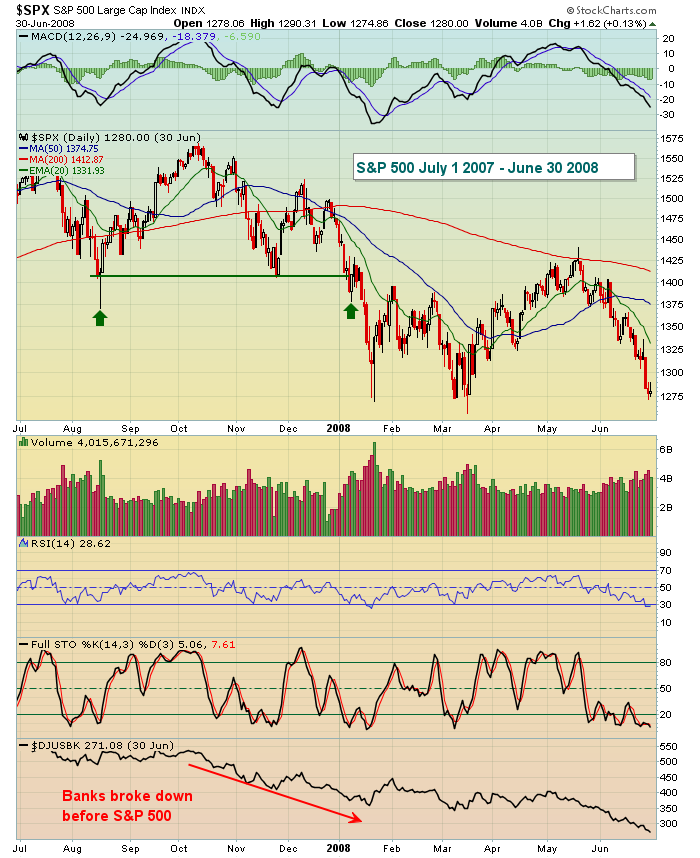 Doesn't January 2008 look strikingly similar to what we have now? If you have doubts, here's the current look using the same chart:
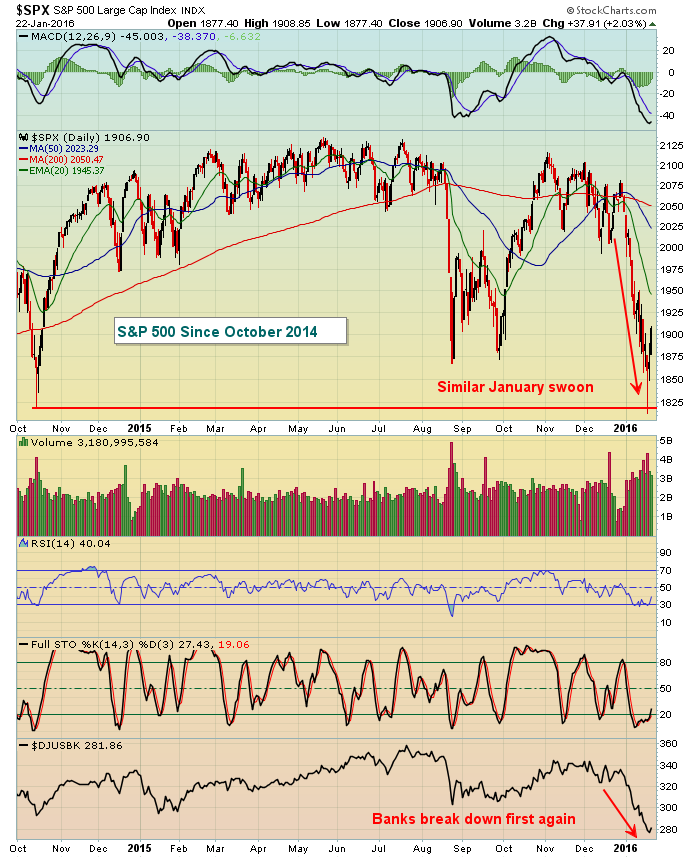 The weakness in banks recently is really spooking me. When banks underperform, there's a much greater risk that credit could be squeezed and that definitely would not be good for economic improvement ahead. Needless to say, be very careful on this bounce as it's not likely to last.
Sector/Industry Watch
I constantly monitor key relationships and ratios to evaluate the "below the surface" strength or weakness of equity advances/declines. For the most part, the end of last week produced decent "risk on" behavior. But as the week neared its conclusion, there was deterioration in a couple areas which always brings into question the sustainability of a rally. Below is an intraday look at the $TRAN:$UTIL relationship. If this rally is to continue, you wouldn't know it by the behavior of transports on Friday (after the open). Check it out:
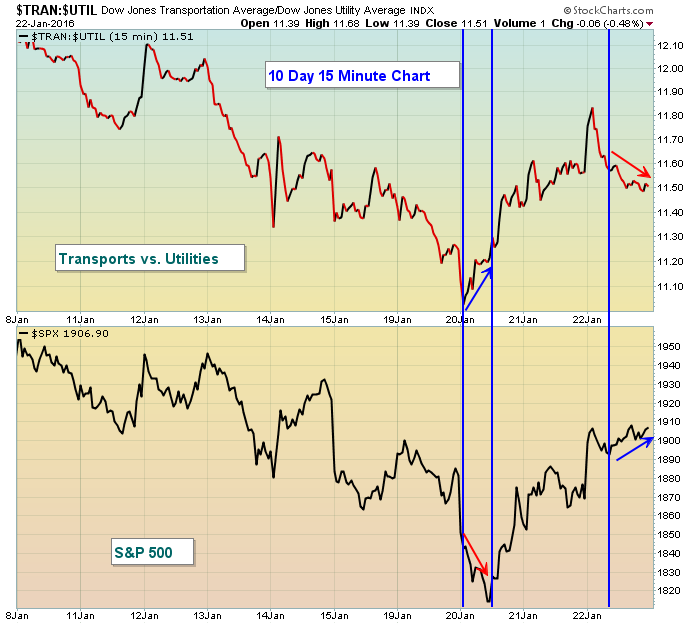 The blue vertical lines above highlight "divergences" in the behavior of the TRAN:UTIL and the S&P 500. These two tend to move in the same direction. So subtle divergences can be helpful in spotting trend reversals. I wouldn't use this ratio solely to determine the direction of the S&P 500 but it's certainly a piece of the puzzle. On Wednesday, note that the S&P 500 was under tremendous pressure early in the day. But money began rotating toward offense before the S&P 500 reversed. That coupled with the high volume reversal and advance in the S&P 500 alerted me to the greater possibility of a continuing march higher.
The action on Friday, however, printed a divergence of a different kind - a bearish one. The S&P 500 kept rallying throughout the day on Friday, but the TRAN:UTIL ratio dropped throughout the afternoon. This may or may not end the short-term rally. I'd feel much more bullish near-term if this ratio continues to climb during the day today.
Historical Tendencies
February tends to be strongest for the Russell 2000 where we've seen average annualized returns of 17.38% since 1988. The S&P 500 actually has been flat on average during the month of February since 1950 with average annualized returns of 0.77%. The NASDAQ (since 1971) has posted average annualized returns of 8.34%.
Key Earnings Reports
(actual vs. estimate):
DHI: .42 vs .42
HAL: .31 vs .24
KMB: 1.42 vs 1.44
MCD: 1.28 vs 1.23
Key Economic Reports
None
Happy trading!
Tom


