Market Recap for Wednesday, January 27, 2016
The volatility index ($VIX) was slowly working its way back to key support near 20 just before Wednesday's latest FOMC announcement, but that provided the fear mongers exactly what they were looking for as the VIX surged in the afternoon to accompany yet another multi-hundred point drop in the Dow Jones ($DJI). They seem to be occurring regularly in 2016 with no end in sight. Shortly after the 2pm EST Fed announcement, the S&P 500 ($SPX) was enjoying a solid day near its intraday high of 1917, more than one hundred points above its prior week low of 1812. Then the next bout of impulsive selling kicked in. More on the FOMC statement in the Current Outlook section below.
Apple's (AAPL) latest quarterly results and outlook did not help as the technology giant's 6.57% drop led the entire technology sector (XLK) to outsized losses on Wednesday as volume again spiked above 2 billion shares on the NASDAQ. In fact, other than financials (XLF), aggressive areas of the stock market were spurned yesterday in favor of safer, higher dividend-yielding alternatives. That's been a major problem throughout the past 5-6 weeks of selling.
Boeing (BA) was another high profile company that posted results falling well short of Wall's Streets expectations as BA dropped nearly 9%, its worst one day performance in many years.
Pre-Market Action
Asian markets were mixed overnight with the Hang Seng ($HSI) rising while both the Nikkei ($NIKK) and Shanghai Composite ($SSEC) fell. European markets are mostly lower, falling in lock step with the U.S. market's Wednesday afternoon selloff. While Apple (AAPL) disappointed Wall Street with its quarterly results and outlook, Facebook (FB) is having an opposite effect this morning as it's results after the bell last night is propelling the tech-laden NASDAQ to relative pre-market gains today. At last check, FB's pre-market gain was more than 13%, potentially sending the stock near its all-time highs at the opening bell. Here's the longer-term technical outlook for the Dow Jones U.S. Internet Index ($DJUSNS), which will be highly impacted by FB's trading today:
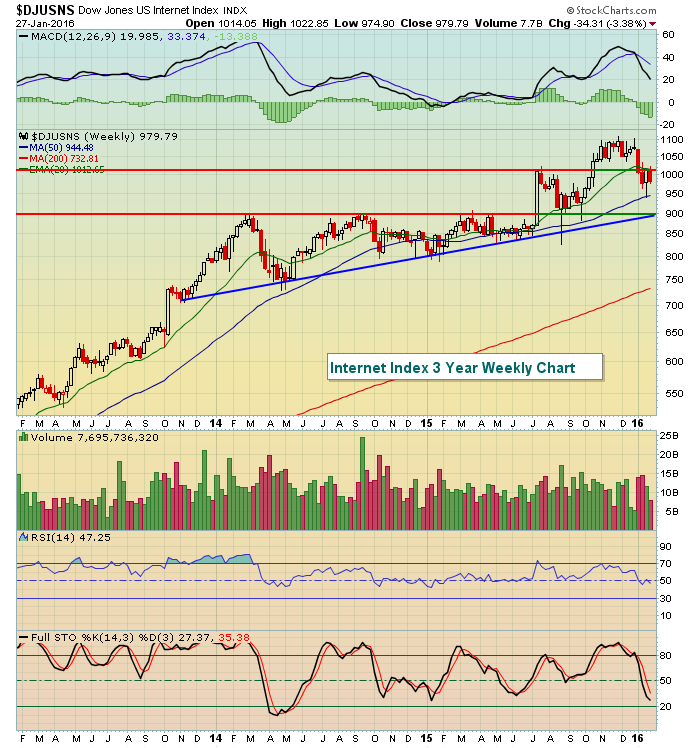 The upsloping blue line marks trendline support near 900, which intersects the next price support level. Recent price support at 1015 failed to hold so that level (along with the falling 20 week EMA at 1012) becomes key resistance on today's likely bounce. A close back above 1015 provides the DJUSNS a much better technical opportunity to challenge prior highs while failure to clear this level brings the 900 support into play.
U.S. futures are higher this morning, but mostly being lifted by FB's strong results. The Dow Jones and S&P 500 show more modest pre-market gains as traders approach a new trading day with trepidation after hearing the latest from the Fed and scouring countless earnings reports out last night and this morning.
Current Outlook
Two things happened to stall the Wednesday rally. Technically, the SPX was nearing its pivotal 20 day EMA where we typically see rallies stall during bearish momentum periods. The 20 day EMA currently resides at 1930. Secondly, the Fed provided its latest outlook on interest rates, global uncertainties, etc. and the market did not like what it heard. The Fed left interest rates unchanged after recently raising them for the first time in nine years and they acknowledged global concerns by saying it is "closely monitoring global economic and financial developments and is assessing their implications for the labor market and inflation, and for the balance of risks to the outlook."
Fed Chair Yellen, let me help you explain what you're referring to by the use of two charts right here at StockCharts.com:
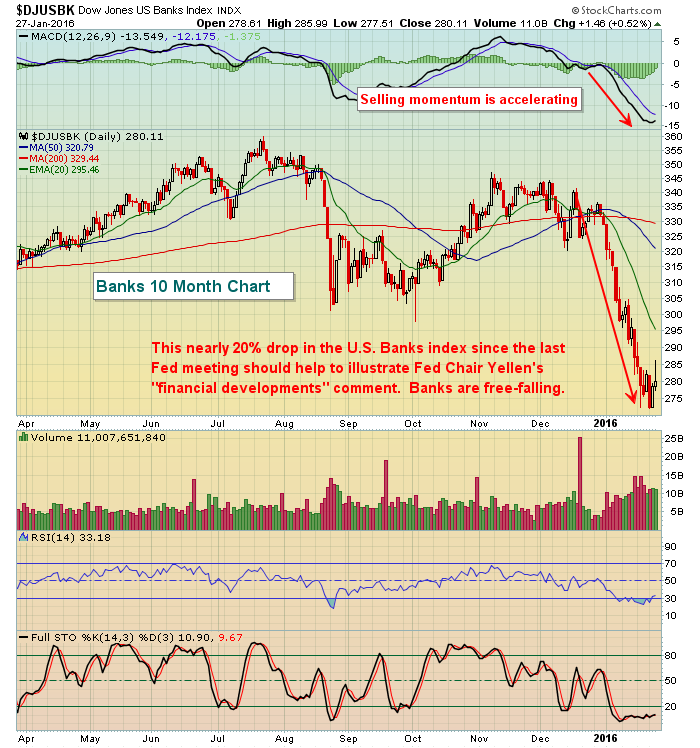 That would seem to be a much more simplistic explanation of the "financial developments" comment, don't ya think? As for "implications for the labor market", how about this chart?
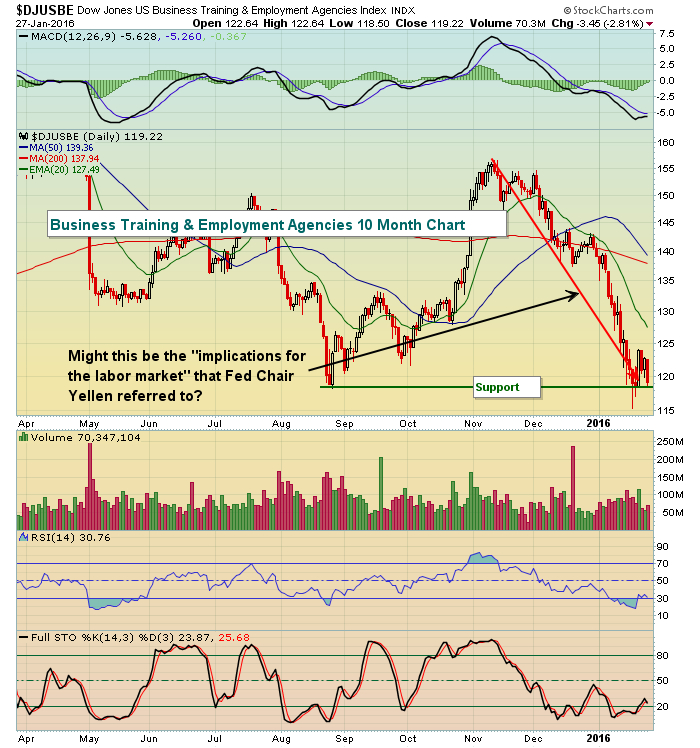 I suppose that a break of price support would result in further "implications for the labor market." The charts tell us where money is flowing - and where it's not. The stock market is discounting prices very quickly as it anticipates weakening economic conditions in the weeks and months ahead. We can choose to ignore these technical signs.....or protect ourselves in some fashion. The recent stock market developments DO NOT GUARANTEE us that the stock market will go lower, they simply warn us of increasing risk. As risk rises, I choose to hibernate....kinda like a bear.
Sector/Industry Watch
I generally reserve this space for U.S. stocks, but the S&P 500 tends to mirror behavior in Germany so let's review the current technical state of the German DAX ($DAX):
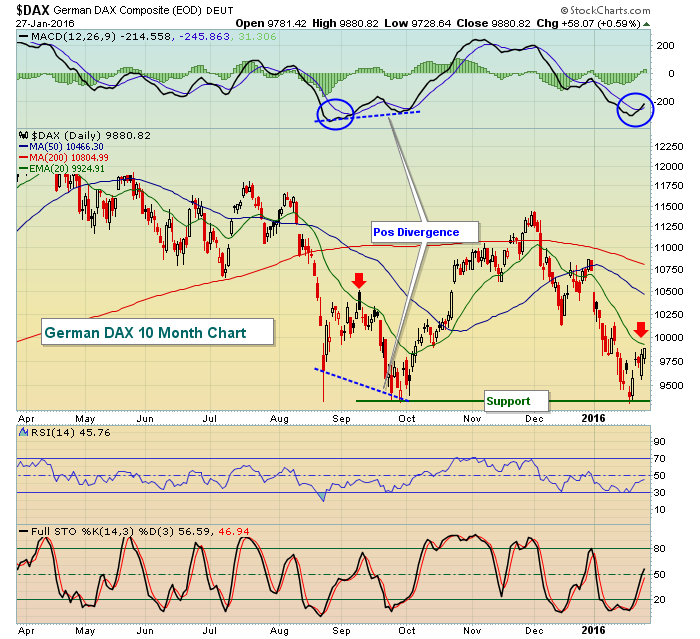 First, keep in mind that the above chart does not show today's action. At last check, the DAX was lower this morning by 155 points to 9725. The current technical picture looks very similar to where the DAX stood back in August as it attempted its initial rebound. That rally attempt failed where? The 20 day EMA (red arrow). The recent rally in the DAX once again approached its falling 20 day EMA and the action this morning marks another failure. At the late-September price low, a positive divergence emerged and that enabled the DAX to sustain a much longer rally throughout October and November. There's much more work to do currently so I'd simply watch the current trading range from price support near 9325 to the declining 20 day EMA, currently at 9925.
Historical Tendencies
For the S&P 500, January 25th (Monday) marked the beginning of a ten calendar day stretch where annualized returns since 1950 are positive. Today's annualized gains are +37.01% while January 29th (tomorrow) has produced annualized returns of +21.42%. This "10 day winning streak" runs through Wednesday, February 3rd.
Key Earnings Reports
(actual vs. estimate):
BABA: .73 vs .70
BHI: (.21) vs (.10)
BMY: .38 vs .27
BX: .37 vs .58
CAT: .74 vs .71
CELG: 1.18 vs 1.22
F: .58 vs .51
HOG: .22 vs .19
HSY: 1.08 vs 1.05
LLY: .78 vs .77
MO: .67 vs .68
NOC: 2.18 vs 1.96
RTN: 1.93 vs 1.79
TWC: 1.80 vs 1.78
UA: .48 vs .46
VLO: 1.79 vs. 1.46
(reports after close, estimate provided):
ALTR: .28
AMGN: 2.27
AMZN: 1.61
EA: 1.70
KLAC: .86
MSFT: .69
SYNA: 1.28
V: .68
Key Economic Reports
December durable goods released at 8:30am EST: -5.1% (actual) vs. +0.2% (estimate)
December durable goods ex-transportation released at 8:30am EST: -1.2% (actual) vs. +0.0% (estimate)
Initial jobless claims released at 8:30am EST: 278,000 (actual) vs. 285,000 (estimate)
December pending home sales to be released at 10:00am EST: +0.8% (estimate)
Happy trading!
Tom


