Market Recap for Thursday, January 29, 2016
Facebook (FB) posted very strong quarterly earnings results after the closing bell on Wednesday and that propelled a huge rally in internet stocks ($DJUSNS). The timing couldn't have been better as the DJUSNS was testing its 50 week SMA in a continuing uptrend. This group, despite recently losing price support near 1015, has remained one of the strongest in the U.S. stock market and the recovery yesterday seems to have rejuvenated the entire industry. Here's the chart:
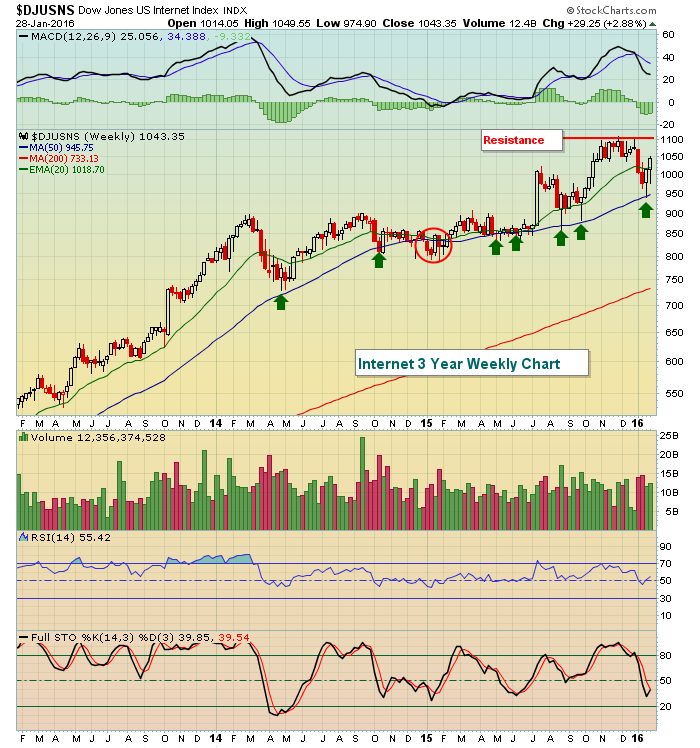 The green arrows have marked many successful tests of the rising 50 week SMA. There was a brief period in early 2015 where this key moving average failed to hold as support. Otherwise, it's represented solid entry during periods of selling.
While FB ignited the internet group and technology overall, energy (XLE) actually posted the highest percentage gain on Thursday and closed above its 20 day EMA for the first time in two months. Price resistance still remains, however, as illustrated below:
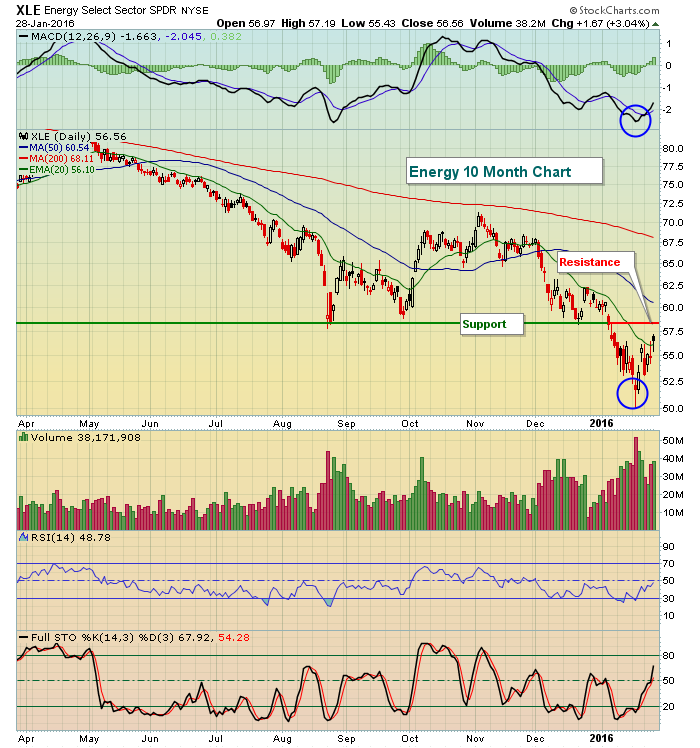 During any downtrend, but especially one in which there's a heavy volume breakdown, the declining 20 day EMAs represent very solid initial resistance. Failure from this level would be no surprise to me at all. Price resistance closer to 58.50 would be the next potential reversal level. A heavy volume close above 58.50 would begin to repair the XLE technically.
Pre-Market Action
Q4 GDP was released less than 30 minutes ago and it was reported at just 0.7% growth, less than the 0.9% growth forecast. This is a fundamental report that supports the technical notion that an economic slowdown and possible recession lies directly ahead. Money has been rotating in a fashion that would support slowing growth and now we see the report itself, an example of price action preceding fundamental news.
The bond market has reacted in very negative (defensive) fashion. Treasuries are on the rise with the 10 year treasury yield ($TNX) falling to 1.93% - a problem technically. Amazon.com (AMZN) reported results last night that disappointed traders and the stock is down 10% this morning, reversing the major gaps higher we've seen the past two quarters.
Asian markets were very strong overnight but do remain technically challenged as momentum is lower and last night's gains simply move these indices closer to a technical sell signal (price resistance/20 day EMAs). European markets are higher, but have retreated from intra-morning highs.
U.S. futures are higher, but have also dropped from overnight highs as traders digest the lower-than-expected Q4 GDP number.
Current Outlook
The price gains were impressive on Thursday and the recent rally is intact in terms of price action. But the makeup of this rally tells me it won't last. Nearly every ratio that I evaluate continues to see downward pressure despite what appears to be reasonably decent stock market action. That's a problem that can easily be reflected on the following chart:
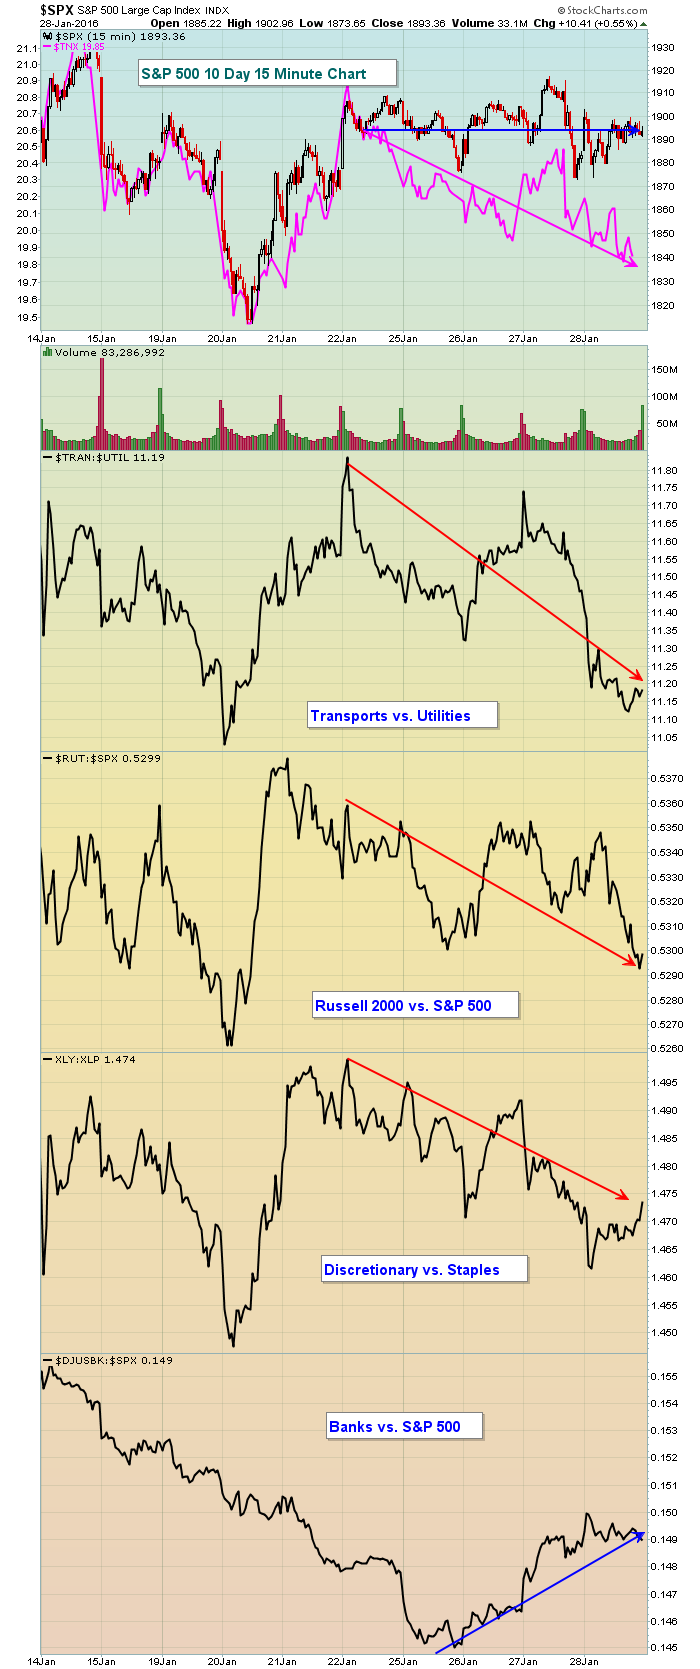 This chart simply screams RISK OFF to me. Over the past week, the S&P 500 is churning near longer-term support established at the November 2014 and August 2015 price lows. The rotation toward defense and safety continues in a major way. Behind the S&P 500 price action above is the 10 year treasury yield or $TNX (pink line). The TNX has fallen back to test major closing support at 1.98%. A breakdown there would be indicative of a bond market that believes our economy will weaken in the months ahead. So many of my technical signs suggests something similar. It's why I cannot commit to this rally, instead potentially looking to open short positions if the rally continues to major price and moving average resistance levels. The first such level would be a 20 day EMA test while price resistance resides closer to 1995.
Sector/Industry Watch
If the S&P 500 is to rise and test price resistance at 1995, it will likely need more strength in the energy sector (XLE). That beaten down sector has much more room to the upside to test key price resistance levels so this group gives the bulls their best shot to clear 20 day EMA resistance on the S&P 500. Among energy industry groups, the Dow Jones U.S. Exploration & Production index ($DJUSOS) shows the possibility of a 10% climb to simply test its falling 20 week EMA. Take a look:
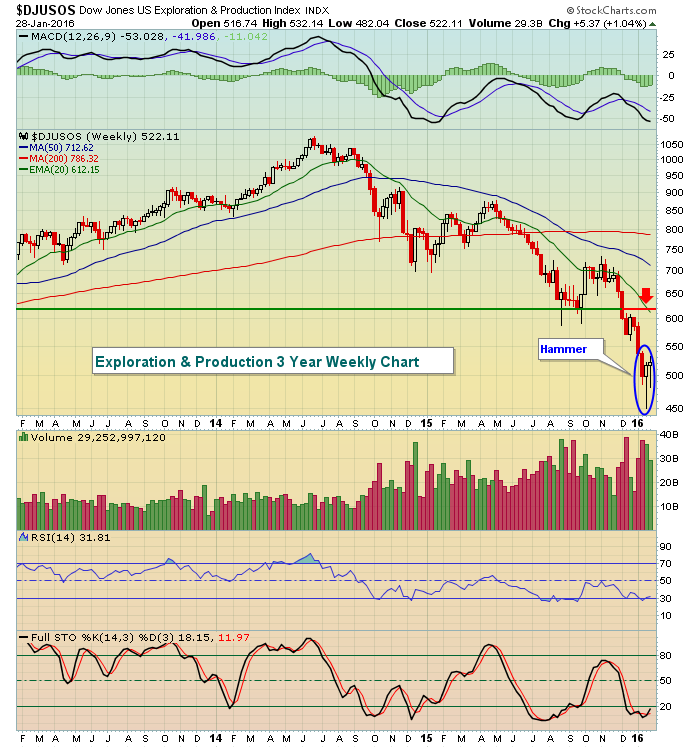 Because energy is so oversold technically on its long-term chart, it would seem to have the best chance of extending a rally to aid the S&P 500 in a continuing rally attempt. Should the S&P 500 rally without the support of aggressive areas of the market, however, we'll likely see a failure and a drop in coming weeks to new lows.
Historical Tendencies
The end of January and early February typically result in higher prices on our major indices. The potential breakout in treasuries (and corresponding breakdown in the TNX) will provide a wall for historical bulls to climb.
Key Earnings Reports
(actual vs. estimate):
AAL: 2.00 vs 1.96
CL: .73 vs .72
CVX: (.31) vs .48 (not sure if these numbers are comparable)
HON: 1.58 vs 1.59
MA: .79 vs .69
PSX: 1.31 vs 1.30
TYC: .42 vs .41
Key Economic Reports
Q4 GDP released at 8:30am EST: +0.7% (actual) vs. +0.9% (estimate)
January Chicago PMI to be released at 9:45am EST: 45.5 (estimate)
January consumer sentiment to be released at 10:00am EST: 93.0 (estimate)
Happy trading!
Tom


