Market Recap for January 8, 2016
Honestly, most traders are probably just happy last week finally came to an end. While Monday through Wednesday consisted mostly of gaps with sideways trading intraday, we saw much more of a concerted selling effort the latter part of the week with bouts of impulsive selling amid a soaring Volatility Index ($VIX). The VIX rose a staggering 48% last week to close out its week at 27.01. In August 2015, we saw four daily closes above 30, but the highest weekly close was 28.03 on August 17th. Clearly, the fear meter is high right now and that's the environment where we could continue to see rapid selloffs. The good news is that significant bottoms are established once all the panicked selling comes to an end. The big question, however, is how deep will the selling take us before a bottom is established.
Also, there has been a mass exodus out of aggressive areas of the market and that was evident all last week. This "risk off" environment suggests that any short-term bounce is likely to be just that - short-term in nature. Bond trading is supporting the theory of economic trouble ahead and the bond market has a history of being smarter than the stock market. Below is a chart showing the TLT:$SPX relative strength rising and nearing key downtrend resistance. A breakout would add to the troubles of the already weakening U.S. stock market. Take a look:
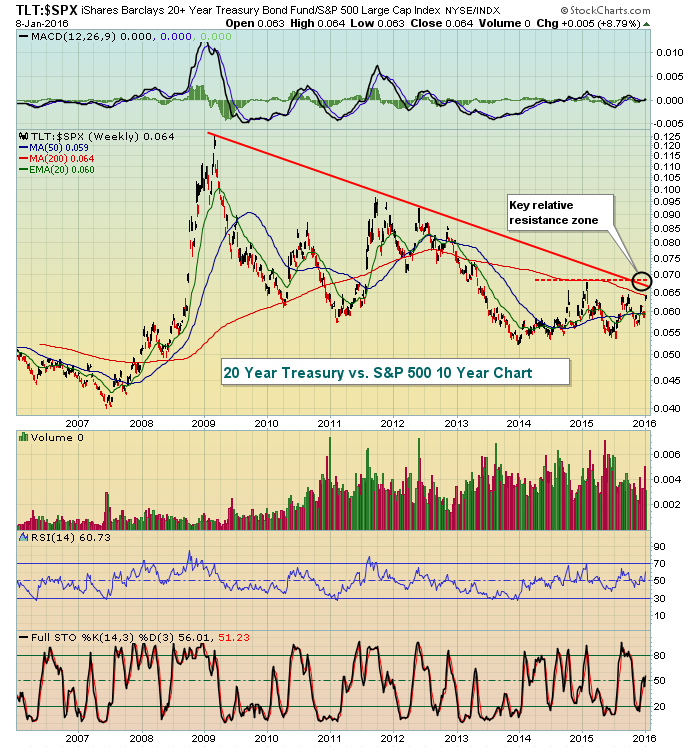
A rising ratio indicates the preference of market participants for treasuries as opposed to stocks. Recent action certainly supports treasuries.
Pre-Market Action
U.S. futures are pointing to a higher open despite heavy selling in Asia overnight. China's Shanghai Composite ($SSEC) fell more than 5% and Hong Kong's Hang Seng Index ($HSI) dropped 2.7%. The U.S., however, is no doubt reacting positively as Europe has largely ignored China's woes - at least thus far today.
Earnings season kicks off after the closing bell when Alcoa (AA) reports its latest results. Analysts are expecting, on average, for AA to report a profit of four cents. While AA is the ceremonial leader for earnings season, I think the next couple weeks will be much more important as big names in aggressive areas of the market report. And it likely won't matter how they did last quarter as traders will be much more interested in future guidance given the shift to defensive areas of the market.
Traders will also be watching the price of crude oil ($WTIC), which at last check was just beneath $33 per barrel. There's a ton of worry and it's been showing in the form of key breakdowns in energy stocks (XLE). The XLE fell beneath August lows, but has printed positive divergences on both its daily and weekly charts. A reversing candle on heavy volume would help to support an aggressive long position (with stops in place of course).
Current Outlook
I remain bullish as long as the long-term charts show higher highs and higher lows. However, there is no sugar-coating what has transpired over the second half of 2015, leading up to the brutal selling to start 2016. Money has been rotating towards defensive sectors and the chart below shows this quite clearly:
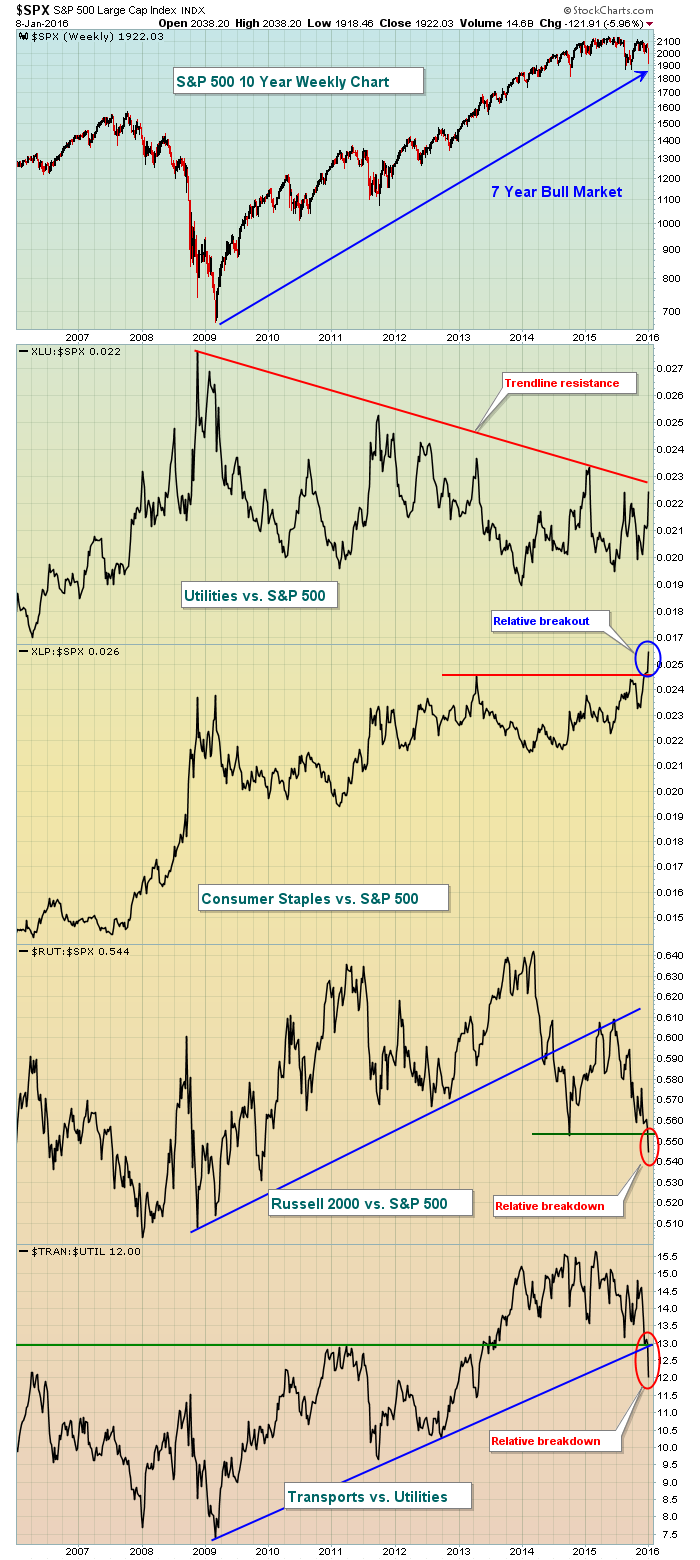
While there's hope that price support holds on the S&P 500 in the 1825-1850 area - and that's the biggest technical indicator of all in my opinion - deteriorating conditions beneath the surface of the market indicate that there's a much higher probability that support will not hold. Continue to be cautious early in 2016.
Sector/Industry Watch
Healthcare (XLV) is mostly considered a defensive area of the stock market, but biotechnology ($DJUSBT) is one of the aggressive areas within that defensive space. Like most other aggressive areas of the market, the DJUSBT is acting quite bearishly, failing at its 20 week EMA, generally a sign of more price weakness to come. Here's the latest chart:
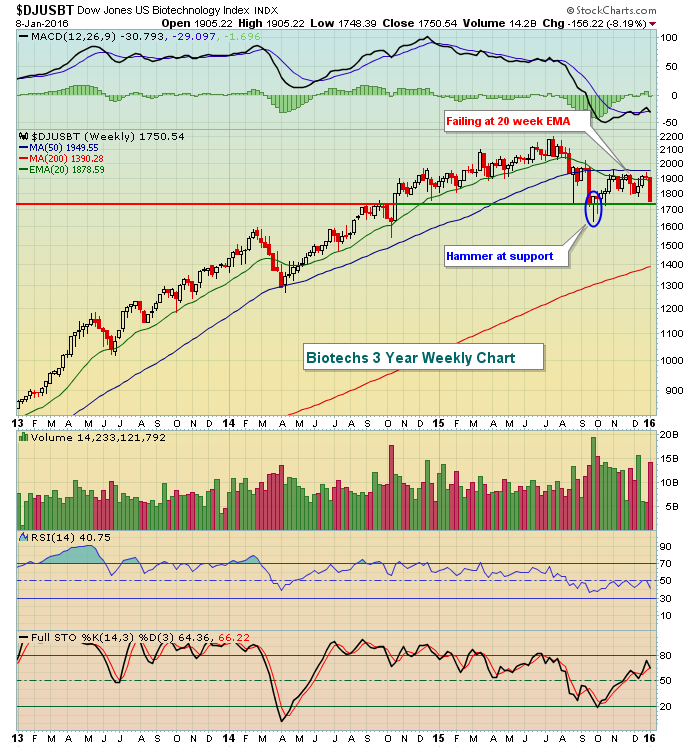
Not only did the group lose more than 8% last week, but it also lost it on very heavy volume. That's a sign of distribution. Therefore if weekly price support is lost, I'd avoid this industry group altogether.
Historical Tendencies
There are two periods of the calendar month that typically favor bullish market behavior. The first is the 28th of one calendar month through the 6th of the following calendar month. The other bullish period is from the 11th to the 18th, which I believe accounts for money flows into the stock market AND the anticipation of those money flows. The January 11th to 18th has historical bullish tendencies. But it's not just January. The S&P 500 over the past 65 years has produced the following annualized returns by the following calendar day of ALL calendar months:
11th: +13.94%
12th: +8.61%
13th: +12.01%
14th: +3.85%
15th: +7.61%
16th: +31.09%
17th: +15.29%
18th: +17.15%
Keep in mind that the S&P 500 has averaged annualized returns of approximately 9% per year. The above shows returns overall in excess of those average returns, indicating the bullish tendency this time of month.
Key Earnings Reports
(reports after close today, estimate provided):
AA: .04
Key Economic Reports
None
Happy trading!
Tom


